- Navigate to the admin panel and you will be directed to the ‘Dashboards’ tab. You will see a list of Dashboard structures if you had created any dashboards previously. Currently, the Dashboard structures list out by descending order of the Dashboard last updated date. The pagination is enabled to show 10 records in a single page. Also, the name of your base hierarchy on Camms.Strategy and the status of the Dashboard will be shown on the Dashboards table.

- You can click on add new button placed at the top-right corner to create a new Dashboard structure. When you click-on add new, a new pop-up window will be displayed to enter data.
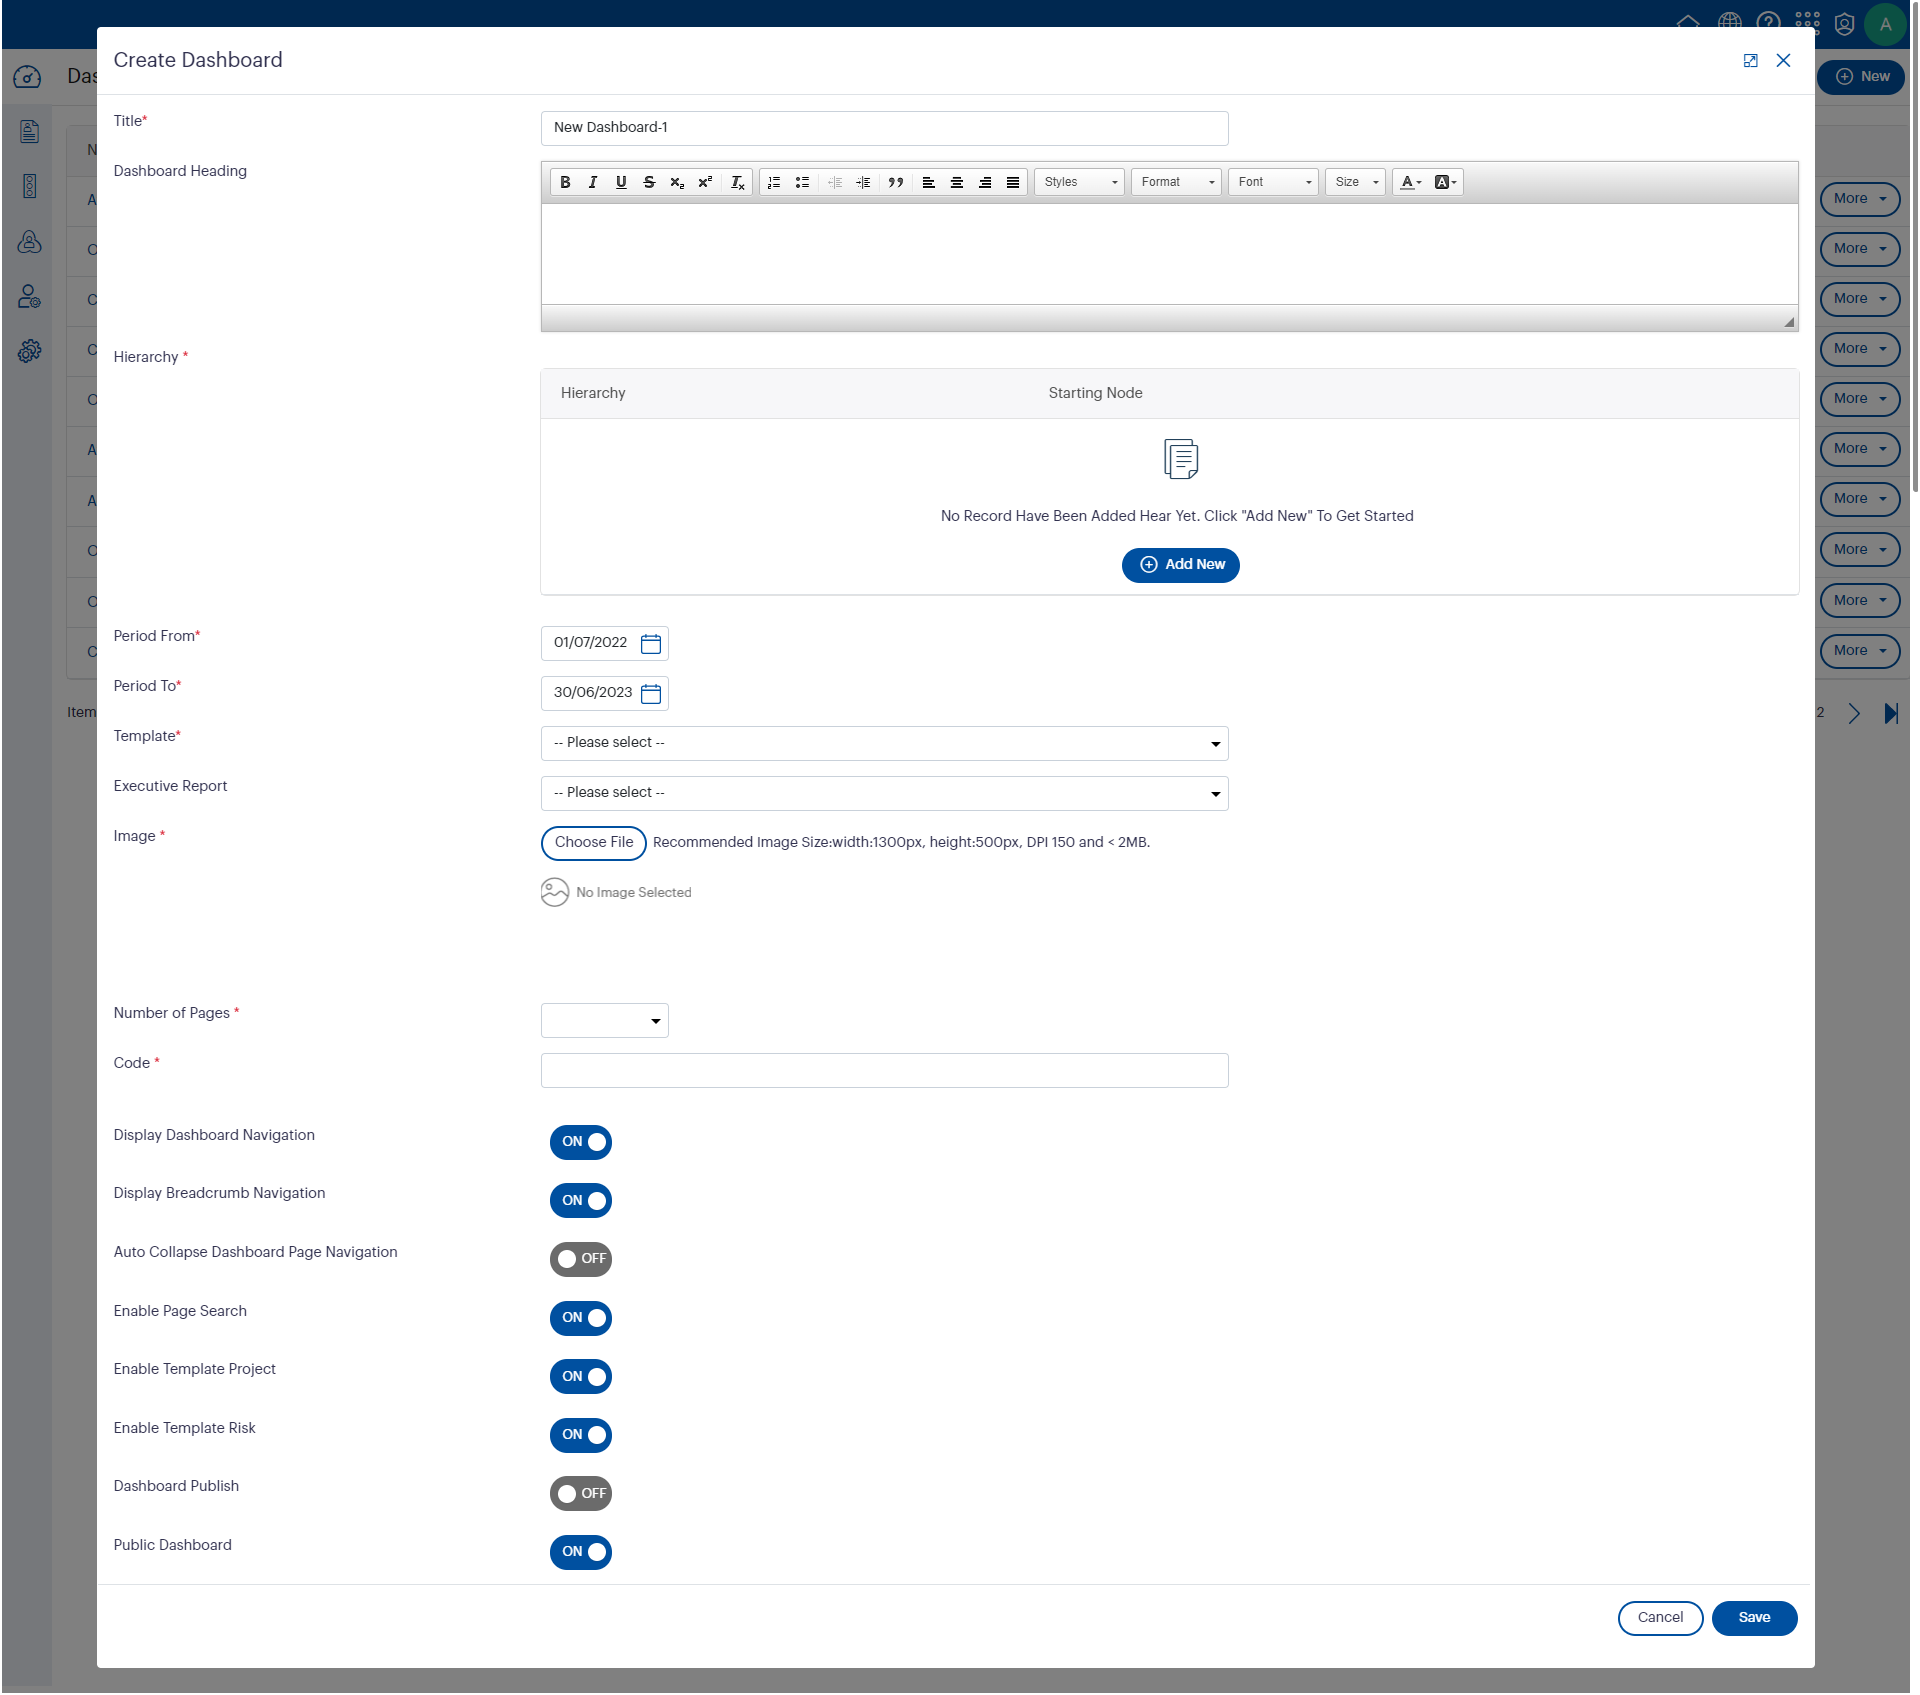
1. Title - Refers to Dashboard name. The name defaults to "New Dashboard– Sequence Number". Users can edit the title as they prefer using this field.
Note - An error message (‘this title already taken’) will be displayed below the title field when the Dashboard name is duplicated.

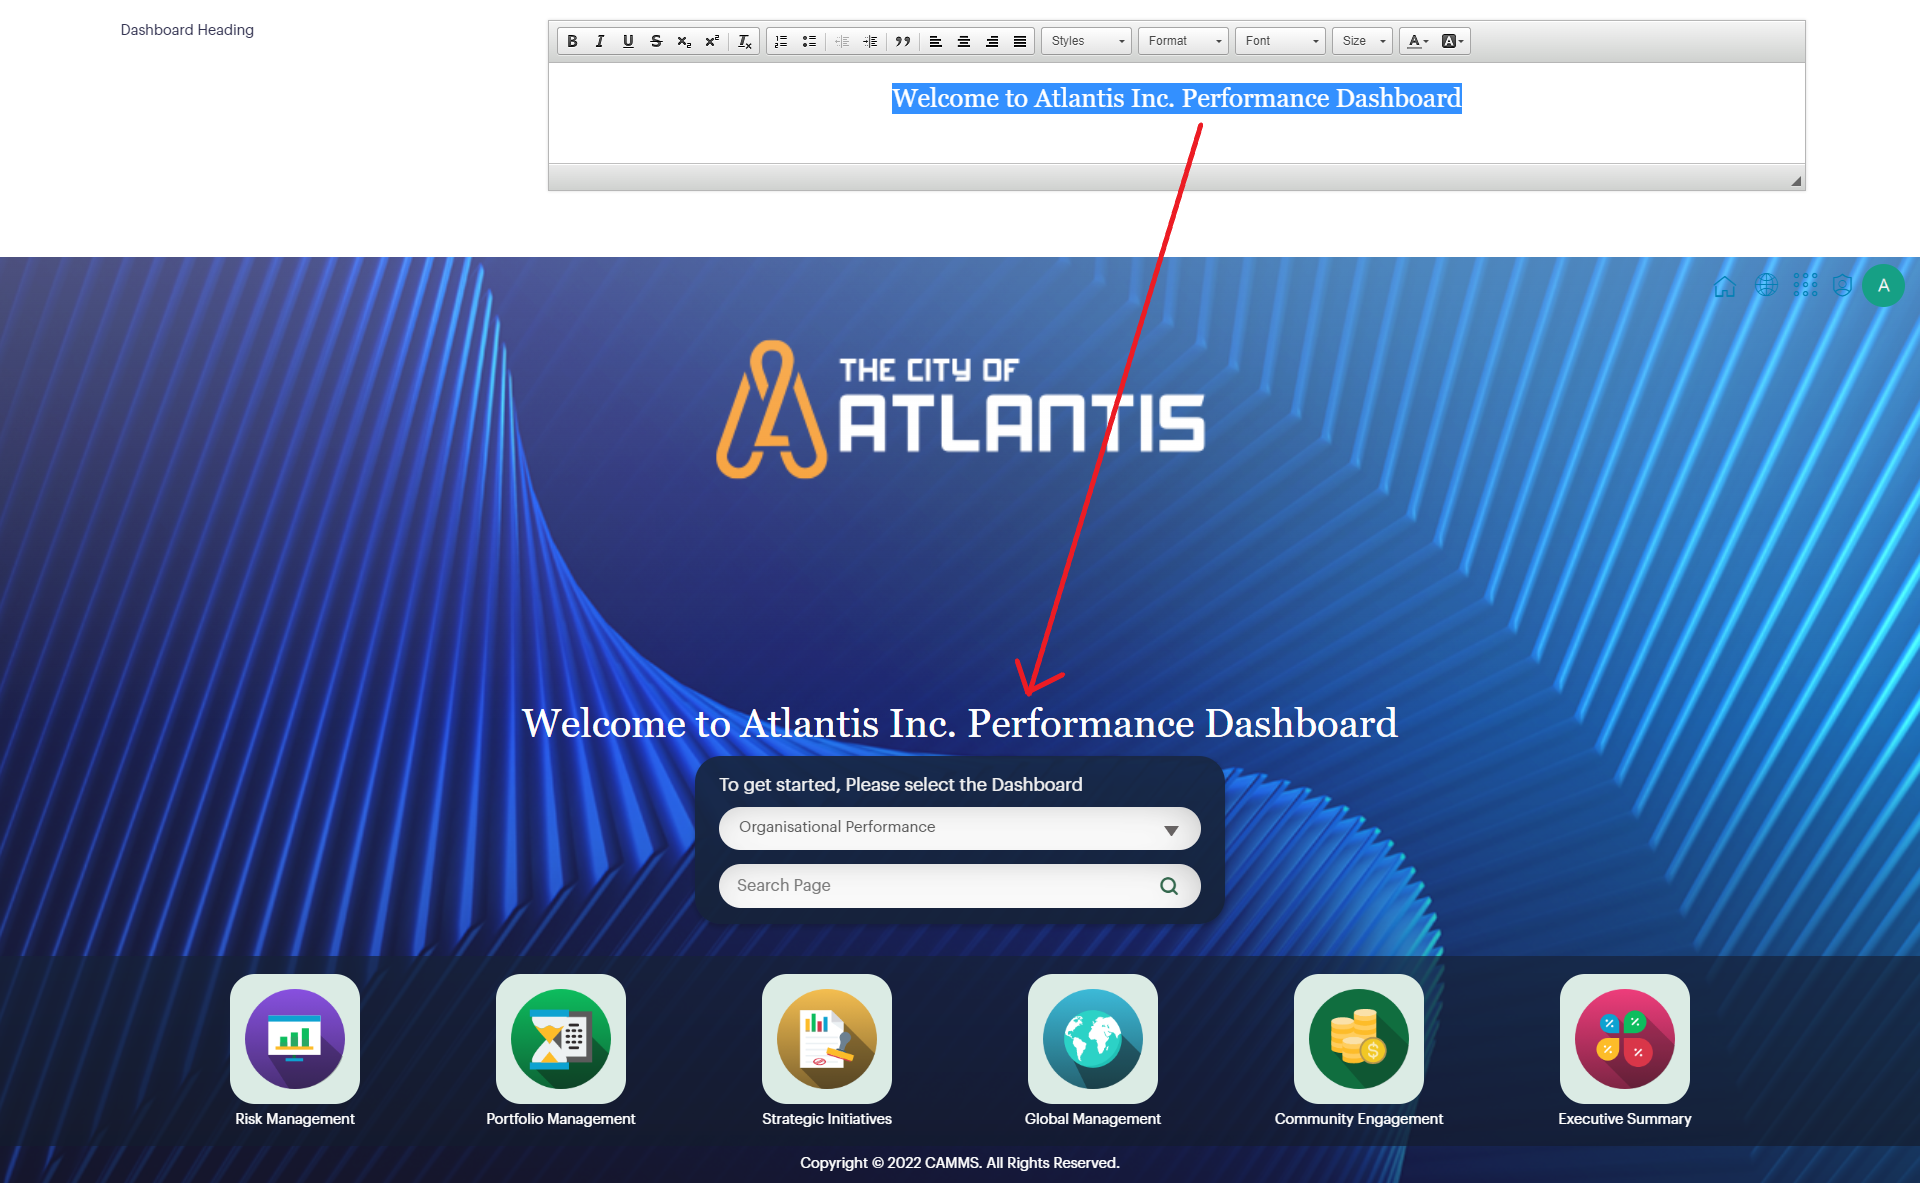
2. Dashboard Heading - This will be a Rich Text field where the content and formatting added on this field will be shown on the Home page of the Dashboard.
3. Hierarchy - All the hierarchies (organization, planning and custom hierarchies) available in Camms.Strategy will be displayed on the ‘Hierarchy’ Drop-down. Therefore, you can select the required hierarchy from the drop-down where all the data added against the selected hierarchy will be transferred on to the Dashboard from Camms.Strategy. Note that you cannot change your hierarchy once a Dashboard structure is created.
4. Starting Node - You can select a node from the selected hierarchy which you want to start the drill down from.
5. Add Hierarchy - Once the starting node is selected, you can click on add hierarchy to configure the Dashboard with that hierarchy. If 'NO' starting node is selected, then the top-most level of the selected hierarchy would be the starting node of the Dashboard. Further, you can configure the Dashboard using multiple hierarchies where the starting nodes of those selected hierarchies would represent together as one hierarchy at the top-level pages on the Dashboard.
6. Period From & Period To - The performance period is selected on these fields. It defaults to the current system period where the Dashboard designer would have the ability to change the performance period as required.
7. Template - The option to add templates is given via Engage Version 3 as the UI and dashboard style is set to be changed based on the template that you select (created by Camms). There will be several templates in the dropdown menu.

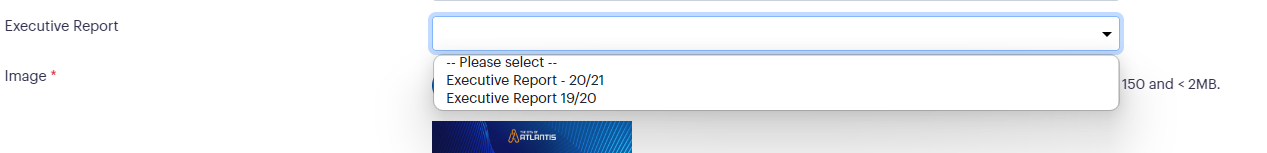
8. Executive Report - You can select an executive report from the dropdown, which was uploaded on to Camms.Strategy, where the executive comments for KPIs will be extracted from the selected executive report.
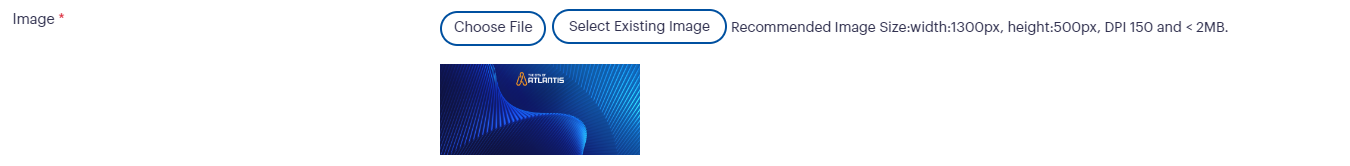
9. Image - You can select an image from your local drive to setup as a banner image on the Dashboard. However, the image should be as per the specification added below the image upload section.
10. Number of Pages – You can select the number of pages to be displayed on the Dashboard banner image.

11. Code - A code can be added for each Dashboard. A unique Dashboard URL which includes the code will be generated for each. Once the URL is entered in your web browser you will be directed to the Dashboard according to the dashboard code.

12. Display Dashboard Navigation - You should enable the toggle button to make the Dashboard navigation visible in the front-end of the Dashboard.
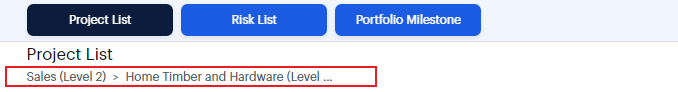
13. Display Breadcrumb Navigation - If you enable this toggle button, you would be able to see a breadcrumb under each component name, in order to know your current location and the navigation path of the hierarchy nodes.
14. Auto Collapse Dashboard Page Navigation - When this toggle button is enabled, you cannot see the left-hand dashboard navigation menu, instead you can view the component in the entire page.
15. Enable Page Search - You can enable or disable the search functionality which would be appeared in order to search a particular page, once you select a dashboard.

16. Enable Template Project/Risk - You can enable the toggle button to choose a template project/ risk in all project/ risk list/node components.
17. Dashboard Publish- You should enable the toggle button to publish a Dashboard.
18. Public Dashboard - You should enable the toggle button to make your Dashboard public. Once the Dashboard is public all the users can view the published Dashboard, if not only the logged in users will be able to view the Dashboard.

- Once everything is entered, you can click ‘Save’ to show on the dashboard.