 Camms is pleased to announce the August Feature Release for Camms.Risk.
This was released on 15th August 2020 and includes the following new features and enhancements to improve your user experience within the system.
- Flexible register configurations
Camms is pleased to announce the release of the ability to flexibly configure risk registers for your organisation.
Note: This feature was in public beta prior to this official release, so some of you may have already seen it in your Camms.Risk solution.
- As an administrator, you will be able to set up the register columns and filters as per your preference for all types of risk registers via the ‘Register Configuration’ area accessed via Cammsrisk > Framework > Risk Settings
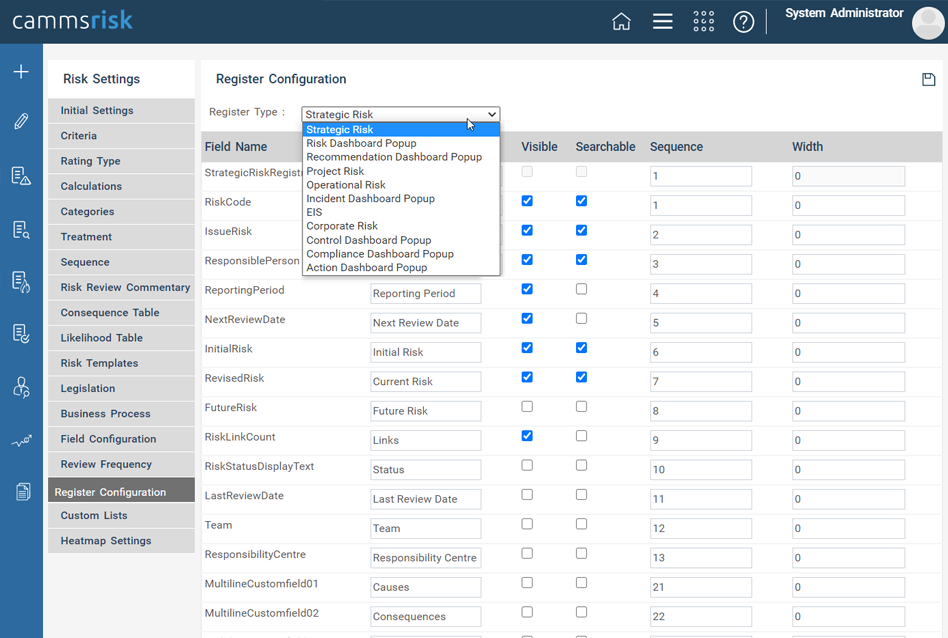
Image 1: ‘Register Configuration’ area
A drop down, listing available register options will be available, and the configurations for columns and filters can be done accordingly. The below options will be available in the drop down containing the configurations for each of these areas.
- Strategic Risk Register
- Operational Risk Register
- Project Risk Register
- Corporate Risk Register
- EIS
- Risk Dashboard Popup
- Incident Dashboard Popup
- Actions Dashboard Popup
- Controls Dashboard Popup
- Recommendations Dashboard Popup
- Compliance Dashboard Popup
Note: The dashboard pop ups refer to the columns shown in the pop up in the Dashboard accessed via Cammsrisk>Workspace>Dashboard when you click on a cell to show their statistics data.
For the 4 risk registers and EIS, the below configurations with functionality will be available.
- Field Name – The standard field name shown in the register
- Label Reference – Any label references to show instead of the standard field name in the register column as the name
- Visible - Whether/not the field is shown in the register as a column
- Searchable - Whether/not the field is shown in the register as a filter
- Sequence – The order in which the filter and columns should appear in the registers
- Width – The width for a column. This will be set to the default width when you first enable a column, but you will be able to change and adjust as required

Image 2: Columns and filters can be configured for each register
- A selected set of standard fields for risks and custom fields will be available in this area to configure here. The desired configurations can be done by ticking the required tick boxes and saving.
- The overall order in which the risk registers appear in the Risk Management area of the solution can be changed from the ‘Risk Register Sequence’ field on top of the page as shown in image 2. This will be a common configuration across all registers for all types, therefore the order should be set up from each page to match the overall.
- For example, you can set your strategic risk register to be ‘1’ and from the operational risk register configuration area, you can set it to be ‘2’ and likewise set up the overall sequence. This is only applicable to risk registers and the control register will remain as it is to be the last register shown.
- This will eliminate the need to stick to the static register views you had so far as the standard product offering and customise the views fitting to your organisation.
- The same behaviour will be applied to the dashboard pop-up areas as well except for the ‘Searchable’ column not being editable as there are no filters in the pop-up views in the dashboard.
2. Quantitative risk assessment
You can now carry out a quantitative risk assessment for any type of risks in your organisation with the ability to assign monetary values for the best, most likely and worst case scenarios to determine the P10, P50 and P90 values derived from Monte-Carlo probability simulation. What this means is that when you enter in your estimate of the financial impact of a risk, the system will be able to tell you the approximate cost for each probability level.
Example: P50 is 50% probability that the cost will be equal to or less than X, P90 is 90% probability that the cost will be equal or less than Y and so on.
How do you configure this?
- As an administrator, you can to enable the quantitative risk assessment feature via the ‘Monte Carlo Analysis’ area accessed via Cammsrisk > Framework > Risk settings > Field configurations.
- This can be enabled for each risk type and also be made visible for each assessment level (inherent/revised/future).
- There is also an option to set the quantitative assessment as mandatory/non mandatory as well, which if set to be mandatory will prompt users attempting to save a risk details page without entering the data.
- Your preferred terminology to refer to in your organisation, instead of the standard ‘Monte Carlo Analysis’, can be set via the ‘Label Name’ option available below.
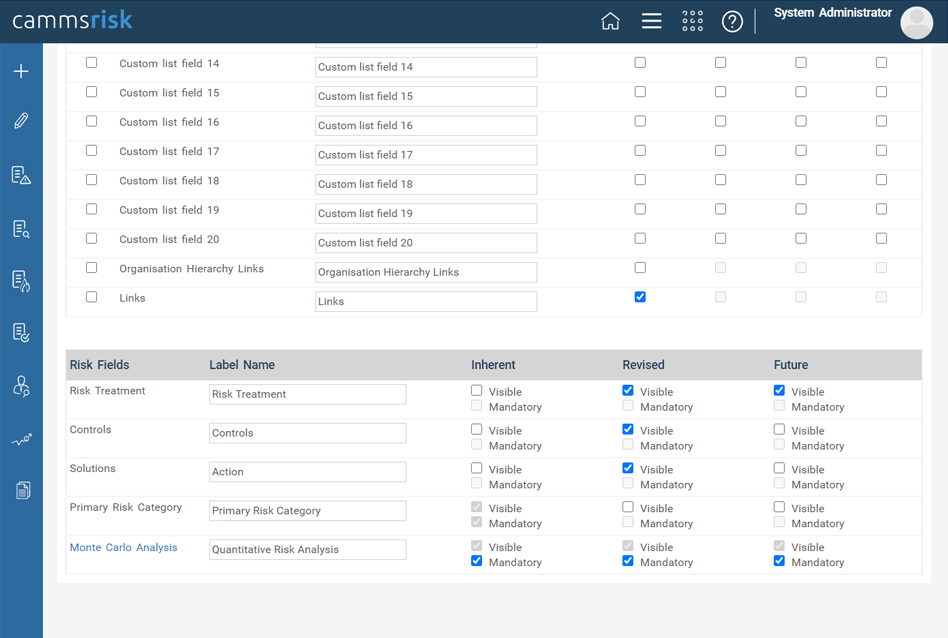
Image 3: Monte Carlo Analysis configuration
- The configuration screen for the quantitative assessment details can be accessed by clicking on the hyperlinked title ‘Monte Carlo Analysis’ under the risk fields column.
- Upon clicking this, the below pop up with the configurations stated will be prompted for the user to set it up.

Image 4: Monte Carlo Analysis configuration pop up
- Best Case Scenario ($) – This will define the monetary value corresponding to the best-case scenario for the risk .
- Most Likely Scenario ($) - This will define the monetary value corresponding to the most likely case scenario for the risk.
- Worst Case Scenario ($) – This will define the monetary value corresponding to the worst-case scenario for the risk.
- Show Quantitative Range Assumptions – A tick box configuration upon enabling will show a multi-line text field to add any comments or assumptions when assigning the values for the three-point estimations above, within each risk. Three separate text boxes for the three points are available here.
- Label Reference – Your desired terminology for the Best Case, Most Likely and Worst-Case scenarios can be configured from here.
- Description - A rich text editor configuration option to define a description against each of the scenarios.
- Likelihood (%) - An integer text box to define the likelihood percentage for the risk scenarios.
- Once the configurations are done, they can be saved via the save button atop the pop up. The configurations will reflect in the end user view in each assessment as shown below.
Note: The rich text editor control has certain limitations in formatting when it's being rendered to the end user view, hence there can be discrepancies when showing certain table/grid formatting with certain font styles.
How will this be shown to end users?
- Any user with view/edit access to risks will be able to view/edit the qualitative risk assessment from within the risk through the assessment levels for which they were enabled for.
- The section will appear on your assessment pages (this will be placed immediately before the risk assessment area) under the label ‘Monte Carlo Analysis’ or any label as per your preference. In this example below, it is configured to read ‘Quantitative Risk Analysis’

Image 5: Monte Carlo Analysis in the end user view
- Three-point estimation areas will be available as per your configurations with text boxes to enter the applicable financial amounts in your desired currency format along with any justifications/commentary in the ‘Quantitative Range Assumptions’ text areas.

Image 6: Point estimation area
- The information icon available against the financial figure input boxes will show any ‘Description’ content configured against each option via configurations from above. When this is clicked, a pop up will appear showing the description thus configured.
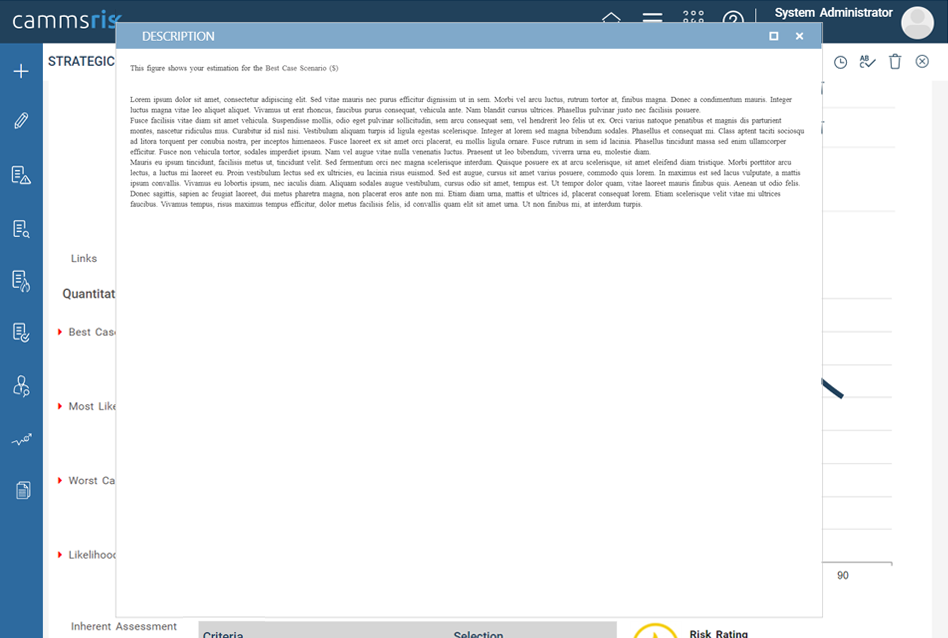
Image 7: Descriptions
- The ‘Likelihood (%)’ field will allow the users to add the probability percentage for the financial value assumptions as well.
- Estimated monetary value projections will be auto calculated and displayed upon entering the three-point estimation values. The P10, P50 and P90 values will be shown here. The standard calculations used for determining the P values are as below. These are system standard calculations and hence will not be configurable to you.

Image 8: Estimated Monetary Values
P10:
(Best case + SQRT (Intended probability of achieving project objectives* (Worst case – Best case) *(Most Likely - Best Case))) * Likelihood
Note: Intended probability of achieving project objectives = 10
P50:
(Worst Case – SQRT (Intended probability of achieving project objectives*(Worst Case-Best Case) *(Worst Case – Most Likely)) * Likelihood
If difference of Worst Case and Most Likely is lesser than difference of Most Likely and Best Case
Best Case + SQRT (Intended probability of achieving project objectives* (Worst Case – Best Case) *(Most Likely - Best Case))) * Likelihood
Note: Intended probability of achieving project objectives = 50
P90:
(Worst Case – SQRT (Intended probability of achieving project objective*(Worst Case - Best Case) *(Worst Case – Most Likely)) * Likelihood
Note: Intended probability of achieving project objectives = 90
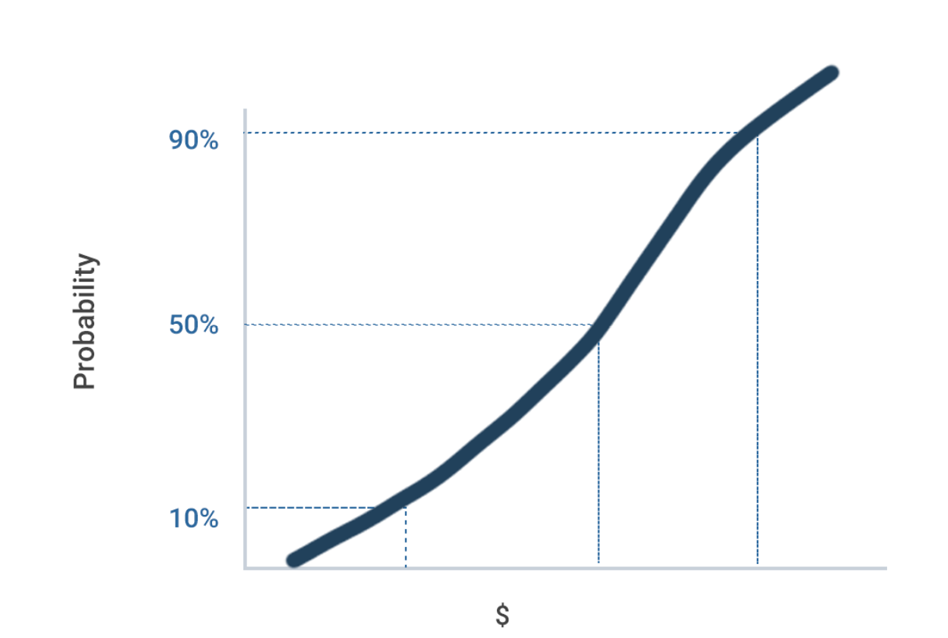
Image 9: The S curve graph
- An S - Curve graph will be shown for each risk which will be improved in the future and to be based on the projections showing the probability in the Y axis and the monetary value-based assumptions on the X axis to show the three point estimated projections.
- The graph will display the probability and monetary value for P value at any level when you hover along the lines and points on the line graph indicting the projects with correspondence to the monetary value and the probability
Note: The quantitative risk assessment will only be available in the risk details pages for the moment and Camms will be improving this feature incrementally to show in reports, insights data sets and dashboards in the subsequent releases. Stay tuned for updates!
3. Integer numbers in the risk rating formula
You can now include integer numbers in your risk rating calculation formula.
- As an administrator, in the risk rating calculation formula you set up at ‘Calculations’ area accessed via cammsrisk>Framework>Risk Settings, you can now include integers.

Image 10: Calculations area
