Camms is pleased to bring you the Quarterly Product Release Notification for Camms.Engage.
This quarter we've got a number of exciting new features and enhancements to improve your user experience within the system, which will be available in your Test environment on 19th June 2021 and will be available in your Live instance on 3rd July 2021.
1. Introducing the Interactive Risk Heatmap component
The new Interactive Risk Heatmap component will now let you showcase risks relevant to a node within the Camms.Engage Dashboard, with the ability to view it on a heatmap. The Initial, Revised, and Future Risk rating summaries will be shown within this component. Once you click on a Risk, you would be able to see the movement of the Risk through different assessment stages. The user would be able to drill down on a Risk to view Risk information.
How do you configure this?
- In the Dashboard Admin panel, a new risk component titled 'Interactive Risk Heatmap' will be available.
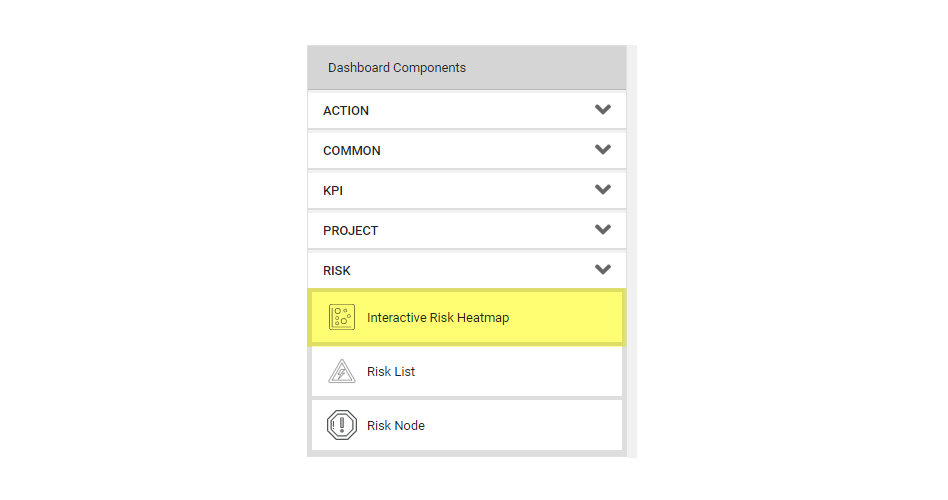
Figure 1.1: Interactive risk heatmap component within the admin panel of the dashboard
- When the Interactive Risk Heatmap component is dragged and dropped into a particular hierarchy node, that will display a list of all the Risks which are linked to that hierarchy node. An administrator can tick the 'Visibility' checkbox of the Interactive Risk Heatmap component in the edit menu, based on the number of Risks which need to be displayed in the front end of the Dashboard.
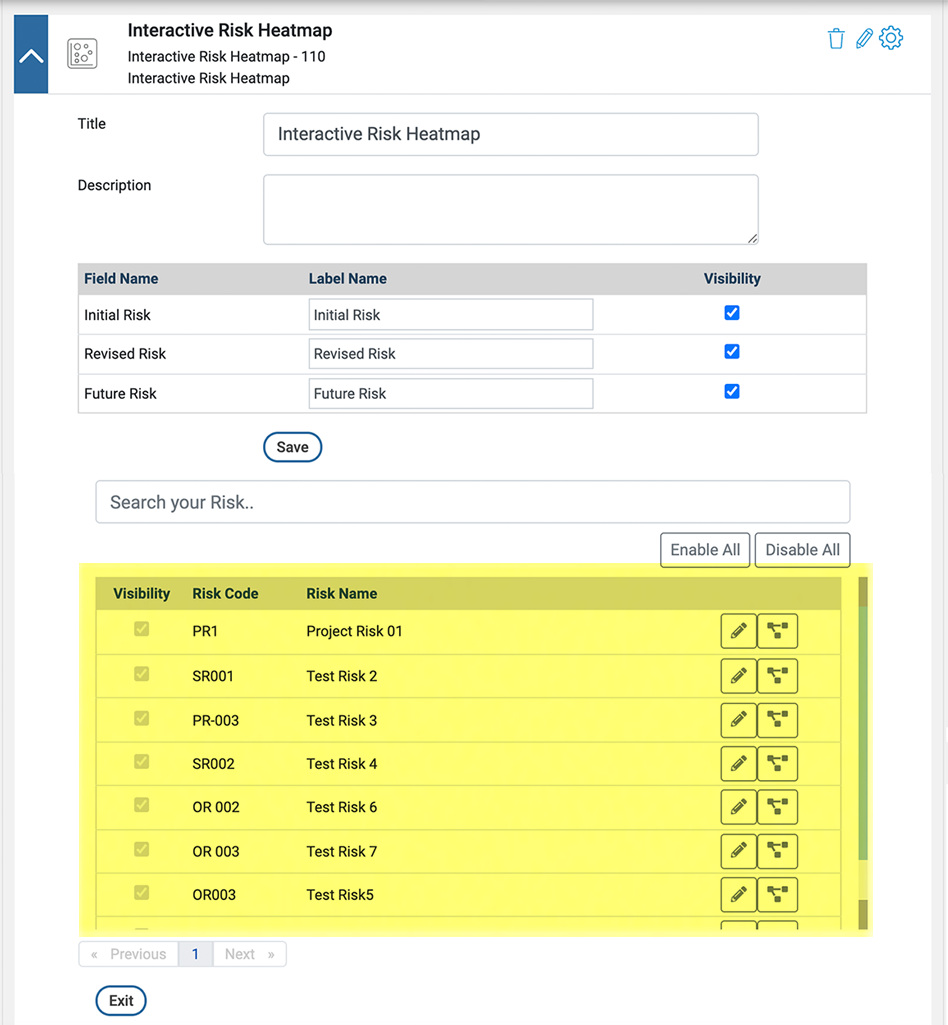
Figure 1.2: Visibility configuration of the linked risks within the admin panel of the interactive risk heatmap component
- In order to see the detailed view associated with the selected Risk, an administrator can drilldown and add the Risk details component, where it will enable the Administrator to configure the fields.

Figure 1.3: Drilldown of the linked risks
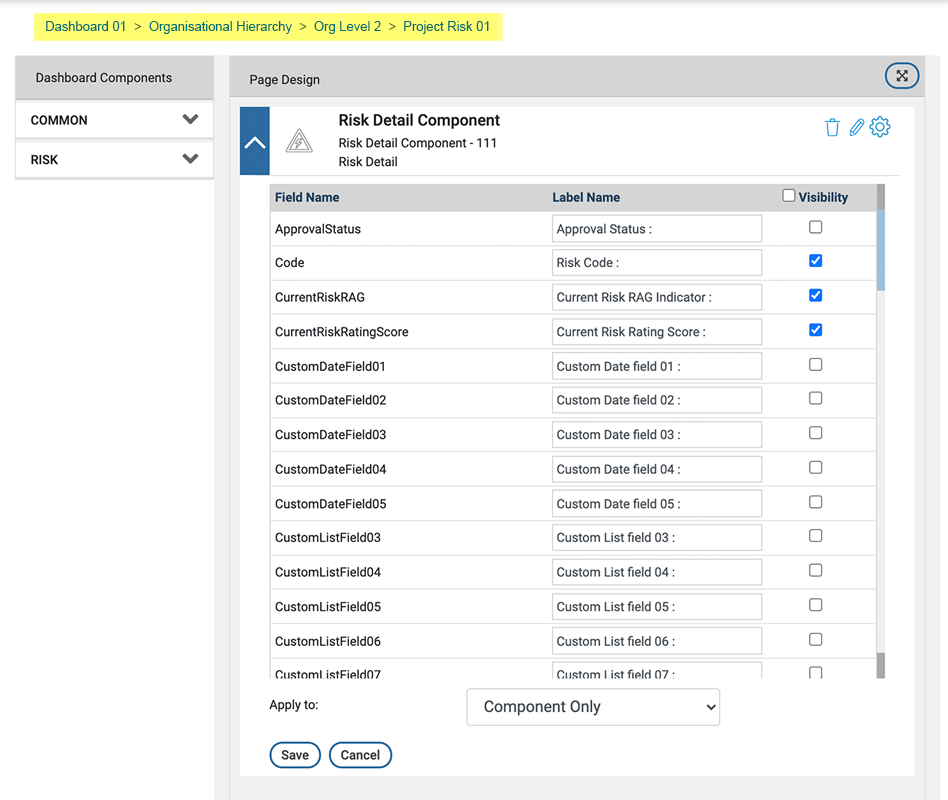
Figure 1.4: Risk details field configuration of the linked risk
- An administrator can tick the 'Visibility' checkboxes in the configuration menu of the Interactive Risk Heatmap component, in order to display the preferred field(s) for the mouse hover over option in the front end of the Dashboard.
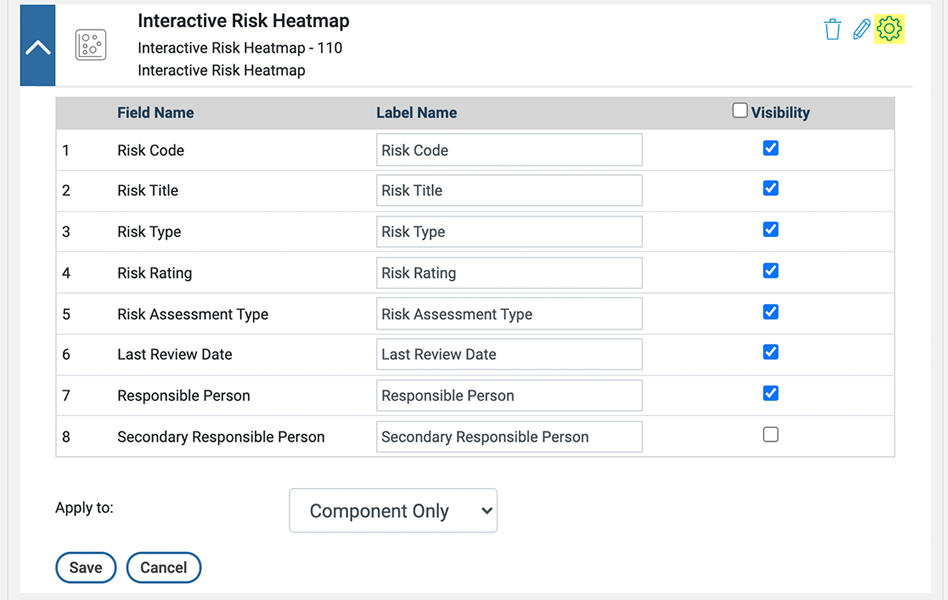
Figure 1.5: Field configuration of the linked risks
How does this work?
- If the visibility checkbox is ticked, the selected 'Linked Risks' will be displayed in the front end of the Dashboard. These Risks are displayed based on the Risk rating values.
- The number of cells and the cell colours available in the Interactive Heatmap would be equivalent to the Camms.Risk application configurations (based on the calculation method, risk rating colours, etc.)
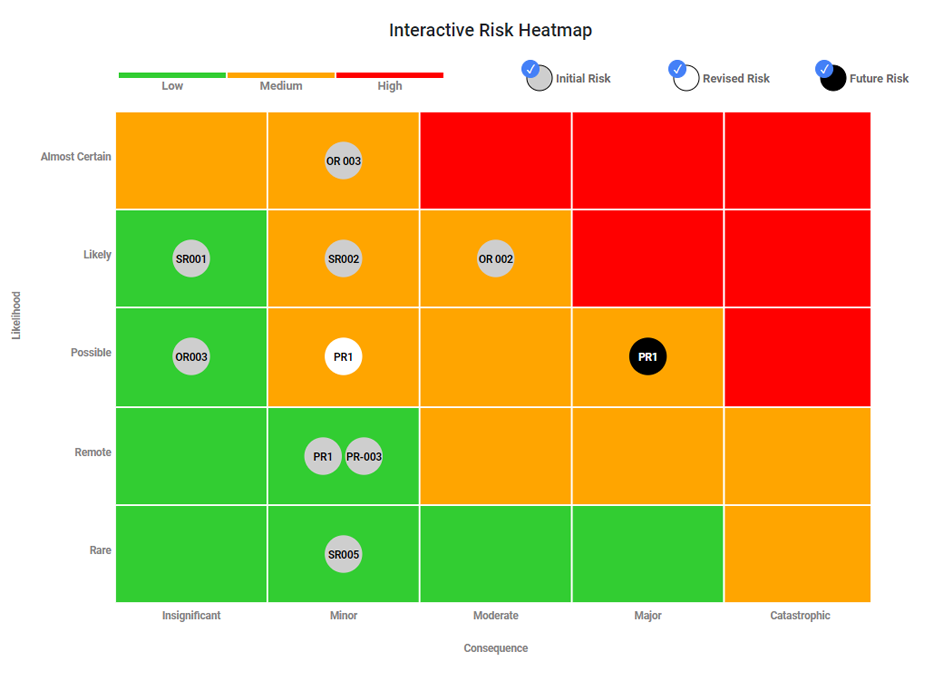
Figure 1.6: Interactive risk heatmap front-end view
- If a user clicks on a Risk within the Interactive Risk Heatmap component, the selected Risk's latest Risk movement would be shown within the Risk Heatmap. The Risk movement would start from Initial Risk Rating, to Residual Risk Rating, to Future Risk Rating, based on the assessments available.
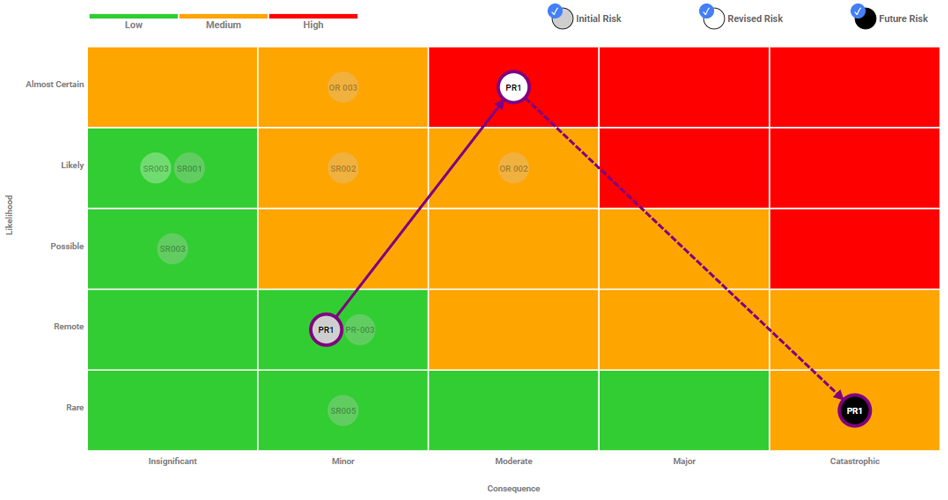
Figure 1.7: Latest risk movement of PR1 risk within the interactive heatmap component
- The user would be able to filter the Heatmap Risks based on the Types of the Risk Assessments (i.e. If Initial, Residual, and Future assessments are available, the user would be able to filter the Risks by Initial and Residual, Residual and Initial and Future).

Figure 1.8: Risk Assessment filtering within the interactive heatmap component
- Clicking on a Risk will activate the tick box field 'Show Timeline Trend' which would enable the entire Risk movement throughout the timeline.
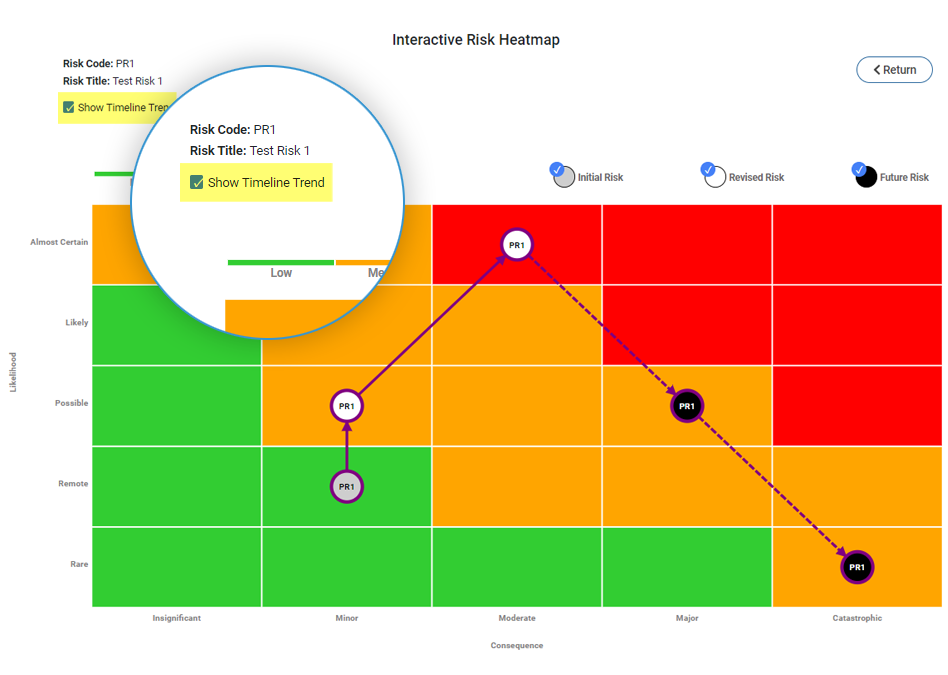
Figure 1.9: Show timeline trend option within the interactive heatmap component
- In addition to the Show Timeline Trend tick box, the Title and Code of the selected Risk would be shown along with the 'View Risk Details' button. Upon selection of the Risk, it will allow the user to display the Risk details in a new drilldown component below the Heatmap.
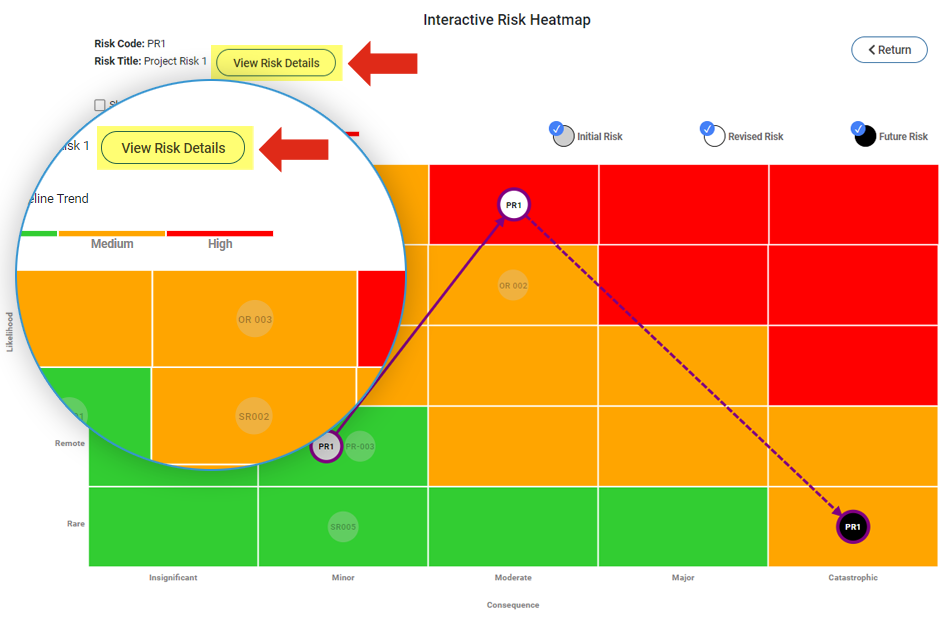
Figure 1.10: View Risk Details option within the Interactive Heatmap component

Figure 1.11: Risk details component of the selected Risk via the Interactive Heatmap
- The user would be allowed to get a sneak peek of the Risk details summary without drilling down by simply hovering over any Risks visible within the Interactive Risk Heatmap.

Figure 1.12: Hover over summary detailed view within the interactive heatmap component
Notes: In addition to the above, the 'Interactive Risk Heatmap Component' will be compatible with all refresh options, rollover option, and all other general features/functionalities of the Dashboard. |
2. View multiple Camms.Project performance RAGs
This enhancement will enable multiple sections of Project performance RAG (Red indicators to be displayed within the ‘Hierarchy Controller’ component in Camms.Engage. This enables to showcase a summary of multiple Project indicators for each node in the Dashboard along with visual improvements to the front-end view of the Hierarchy Controller. This can be configured by an Administrator and then be displayed to users.
How do you configure this?
- In the Dashboard Admin panel, a new multi-select dropdown list field will be available under the 'Performance Field' column where the visibility of each list item can be configured.

Figure 2.1: Performance field within the admin panel of the hierarchy controller component
- An administrator can tick on the 'Visibility' checkbox of any number of Performance RAGs in the configuration menu of the Hierarchy Controller component, to display the selected field(s) on the front end of the Dashboard.

Figure 2.2: Project performance RAGs visibility configuration
How does this work?
- If the visibility checkbox is ticked, the selected 'Project Performance' summary RAG(s) will be displayed in the front end of the Dashboard.
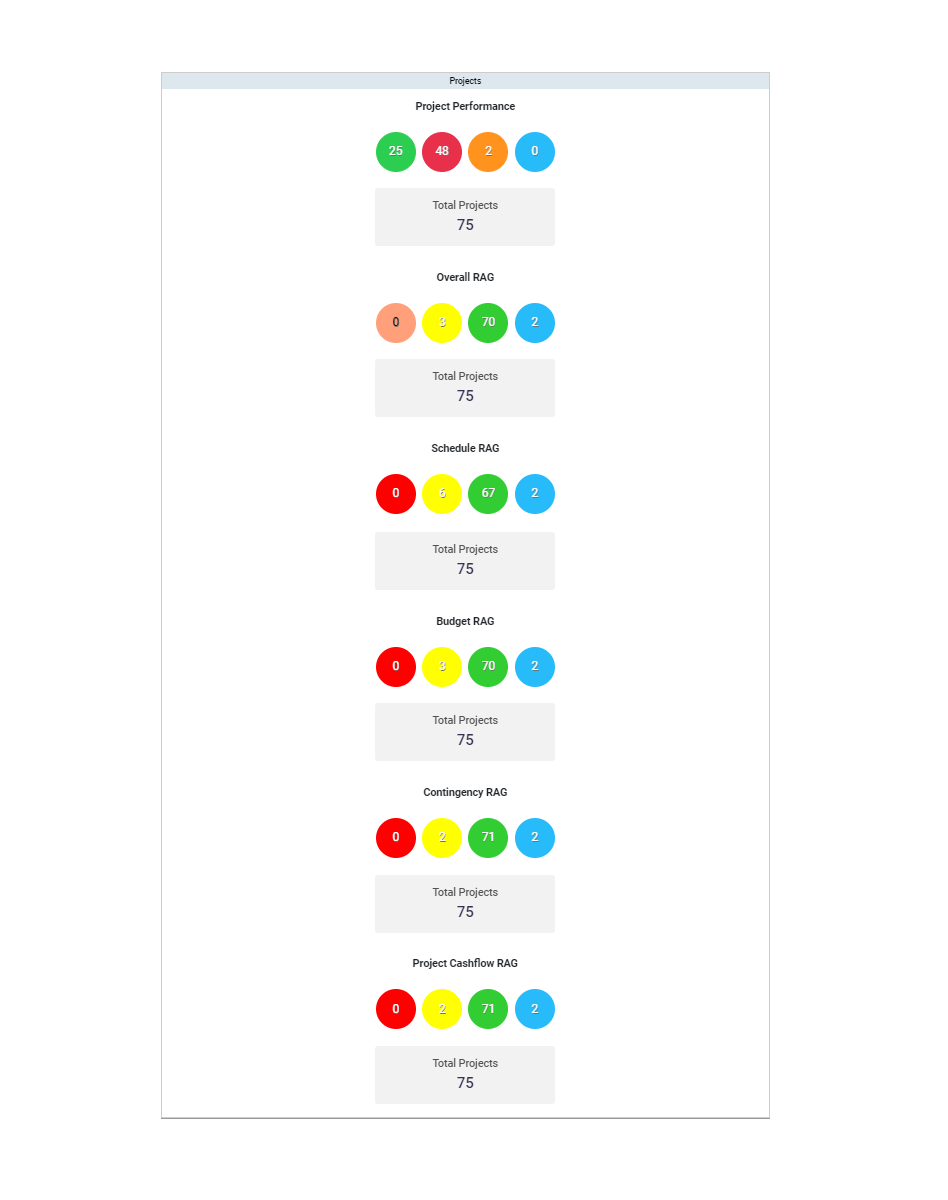
Figure 2.3: Legend view of project performance RAGs within the front-end of the dashboard
 Figure 2.4: Donut view of project performance RAGs within the front-end of the dashboard
- If the visibility checkbox is not ticked, the selected 'Project Performance' summary RAG(s) will not be shown in the front end of the dashboard.
Notes:
|
3. Easy navigation to User Guide
This Enhancement will now provide the Administrators the ability to easily access Camms.Engage user guide via the new '?' icon introduced within the header section of Camms.Engage.
How does this work?
- When an administrator logs in to Camms.Engage, the new '?' support icon would be visible within the Admin panel of the Dashboards.

Figure 3.1: Support icon placement within the Admin panel of the dashboard
- Clicking the "?" new support icon will display a list of all the support tasks available for a logged in administrator.

Figure 3.2: List items of support icon
- In order to view the Camms.Engage User Guide, an administrator should click on the 'User Guide' option from the list items available within the support icon.

Figure 3.3: Selection of the User Guide option
- Once the 'User Guide' option is selected from the list items, a new tab would be opened in the browser and the logged in user would be redirected to the User Guide page of Camms.Engage.

Figure 3.4: Camms.Engage user guide on the Camms support portal
Notes:
|