The Executive Explorer offers an overall view of project performance. It also displays the budget performance and use of the resources as well.
To view the Executive Explorer, navigate to 'Project Navigation' menu.

The options available in the executive explorer are as follows:
- Project Dashboard
- Portfolio Project View
- Project Budget
- Resource Allocation
- Financial Target
- Account Summary
- Project Overview
- Project Charts
- Project Milestones
Project Dashboard
There are two sections within project dashboards: Dashboards and Overview.
- Dashboards: Different widgets on project progress will be available.
- Overview: Summarised view of the projects for a selected hierarchy node.
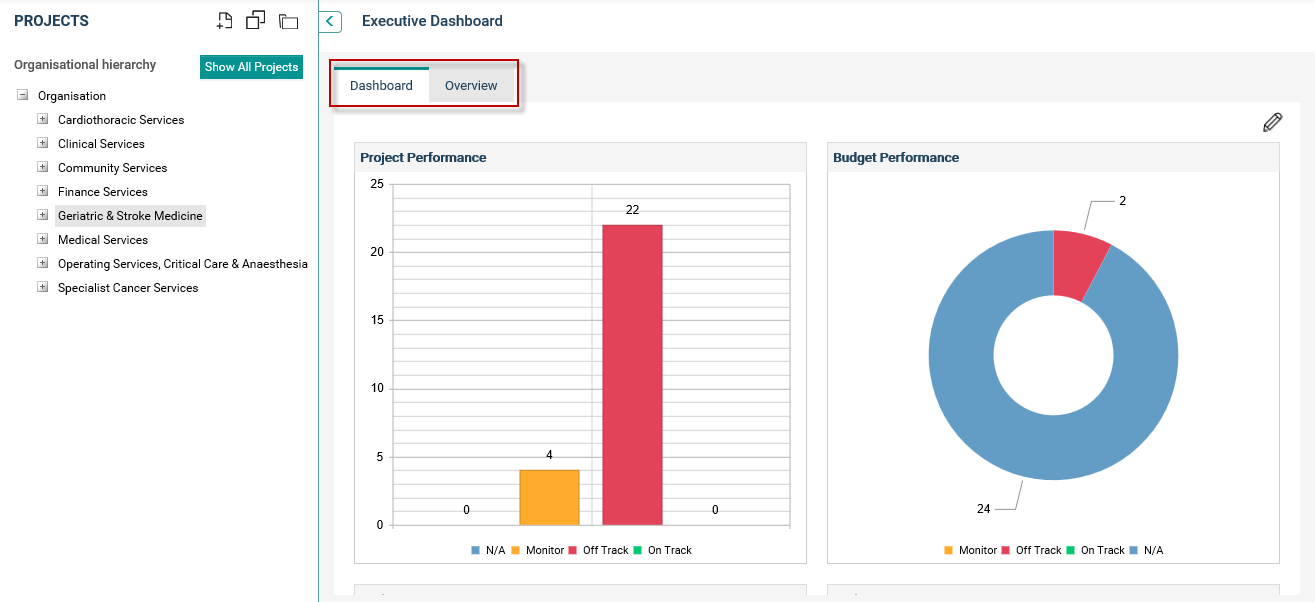
Following widgets will be included within dashboards section:
- Project Progress
- Budget Performance
- Project Status
- Project Risk
- Project KPIs
- Project Duration
- Project Cost
- Project Total Effort
These are explained in detail in Dashboard Widgets section.
- Add Project Icon – New Project popup window will be opened.
- Duplicate Project Icon – Navigate you to the duplicate project screen.
- Open Project Icon – Open project popup window will be displayed.
- Option to Expand/Collapse – You can expand/collapse the entire left side panel.
- ‘Show All Projects’ button - Click to view details of all projects in the organisation.
- Edit Icon – Click on the edit icon to view project dashboards in edit mode. Refer Editing Executive Dashboards.
Dashboard Widgets
Project Progress
Project Progress widget displays the overall progress of projects in terms of on track, off track, monitor and not available.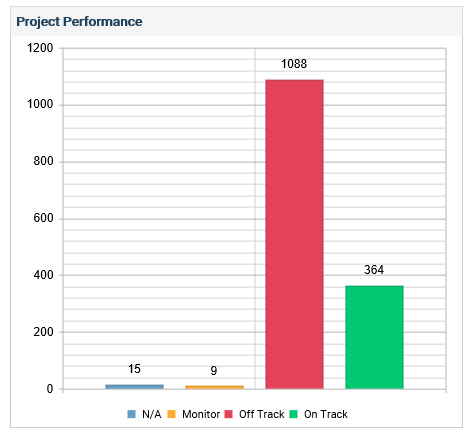
You can view the progress as a ‘Bar Chart’ or ‘Doughnut Chart’. You can set a relevant view by clicking on the ‘Edit’ icon.
In the bar chart, the X axis displays the status (On Track, Off Track, Monitor, Not Available)
The Y Axis, indicates the percentage (or numbers, based on the selected filter options).
- Click on a section of the widget to view more details.
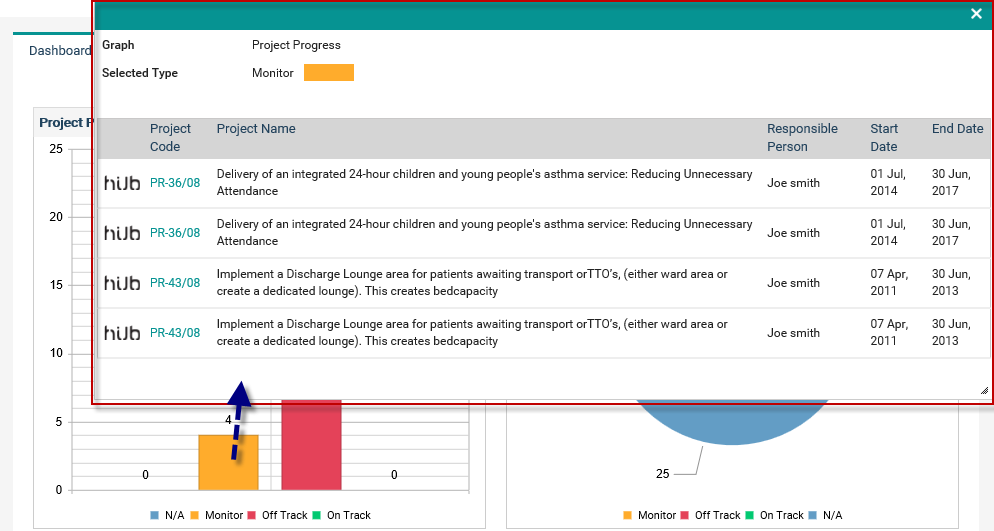
- The details will be displayed in a grid as shown above.
- The graph name and selected area details are mentioned above the grid.
- The Project Code is hyperlinked. Click on it to navigate to the project detail object within the workflow in a new tab.
- Click on the ‘Hub’ icon stated against a project to navigate to the hub area in a new tab. You will be navigated to the default hub area, which is configured via My Settings.
Budget Performance
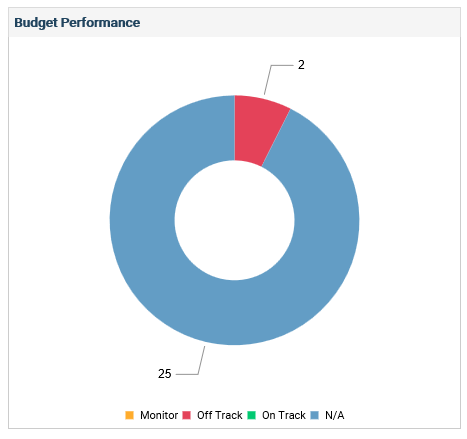
- The budget performance widget displays the overall budget performance of projects.
- You can view the budget performance as a ‘Bar Chart’ or ‘Doughnut Chart’. You can set a relevant view by clicking on the ‘Edit’ icon.
- In the bar chart, the X axis displays the status (On Track, Off Track, Monitor, Not Available)
- The Y Axis, indicates the percentage (or numbers, based on the selected filter options).
- Budget performance of the project will be based on the implementation budget.
- Click on a section of the widget to view more details. A grid will be displayed.
- The graph name and selected area details are mentioned above the grid.

- Project code is hyperlinked. Click on it to navigate to the project detail object within the workflow in a new tab.
- Click on the ‘Hub’ icon stated against a project to navigate to the hub area in a new tab. You will be navigated to the default hub area, which is configured via My Settings.
Project Status
Project Status widget displays the projects categorised as per the Project Status.
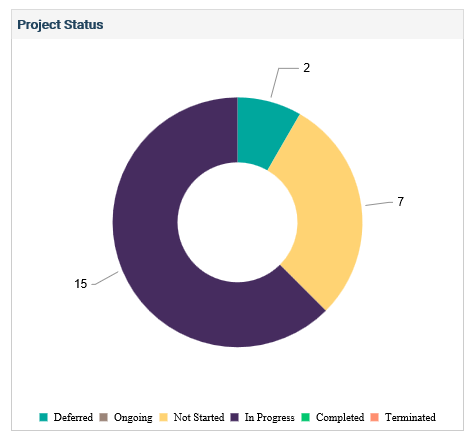
- You can view the status as a ‘Bar Chart’ or ‘Doughnut Chart’. You can set a relevant view by clicking on the ‘Edit’ icon. By default it will be shown as a doughnut chart.
- In the bar chart, the X axis displays the status (In Progress, Differed, Completed etc.)
- The Y Axis, indicates the percentage (or numbers, based on the selected filter options).
- The Status for the project is referred from the ‘Projected Status’ field in the ‘Project Details’ object.
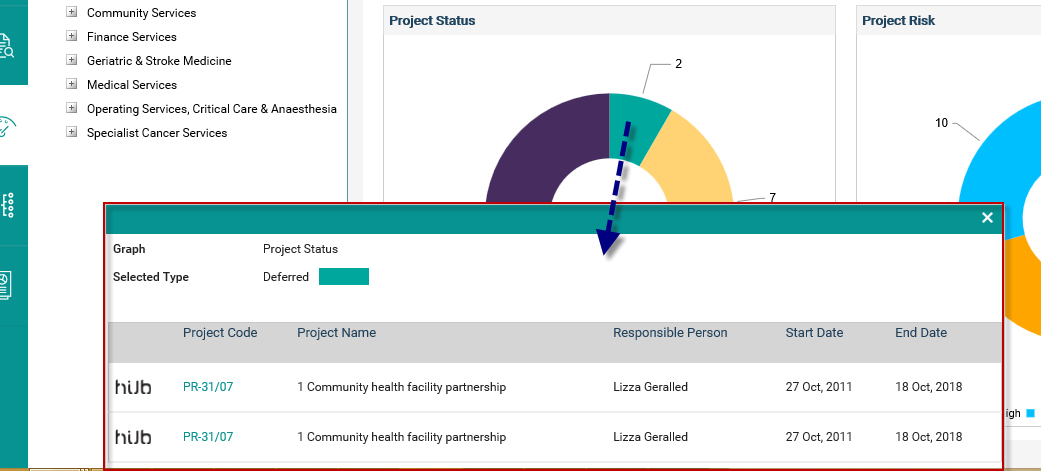
- Click a section of the widget to view more details. A grid will be displayed.
- The graph name and selected area details are mentioned above the grid.
- Project code is hyperlinked. Click on it navigate to the project detail object within the workflow in a new tab.
- Click on the ‘Hub’ icon stated against a project to navigate to the hub area in a new tab. You will be navigated to the default hub area, which is configured via My Settings.
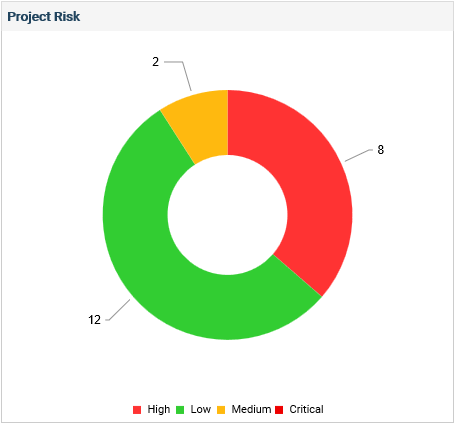
Project Risk
Project Risk widget displays the project risks (available in the Risk Assessment object) categorised as per the risk rating type
- If a ‘Risk Assessment’ object is not available in any of the project workflows, then the message “Risk Assessment object is not configured in project workflows” will be displayed. The legend will be displayed if the colours are configured for the rating type (within the risk setting area).
- If the ‘Risk Assessment’ object is available in the project workflow, however, there are no risks included in the ‘Risk Assessment’ object, then the message “There are no risks linked to projects” will be displayed.
- The Project Risks are categorised as per their risk rating types in the Current Risk Assessment Level of the risk. Current risk assessment level of a risk will be derived as follows;
- If there are no risk assessments for the risk, then the current risk assessment will be Initial Risk Assessment.
- If there is a rating in the Initial Risk Assessment, then the current risk assessment will be Revised Risk Assessment.
- If there is a rating in the Future Risk Assessment, then the current risk assessment will be Future Risk Assessment.
- Risks with no rating will be categorised under N/A section.
- You can view the risks as a ‘Bar Chart’ or ‘Doughnut Chart’. You can set a relevant view by clicking on the ‘Edit’ icon. By default it will be shown as a doughnut chart.
- In the bar chart, the X axis displays the Risk Rating Type (High, Moderate, Low etc.)
- The Y Axis, indicates the percentage (or numbers, based on the selected filter options).
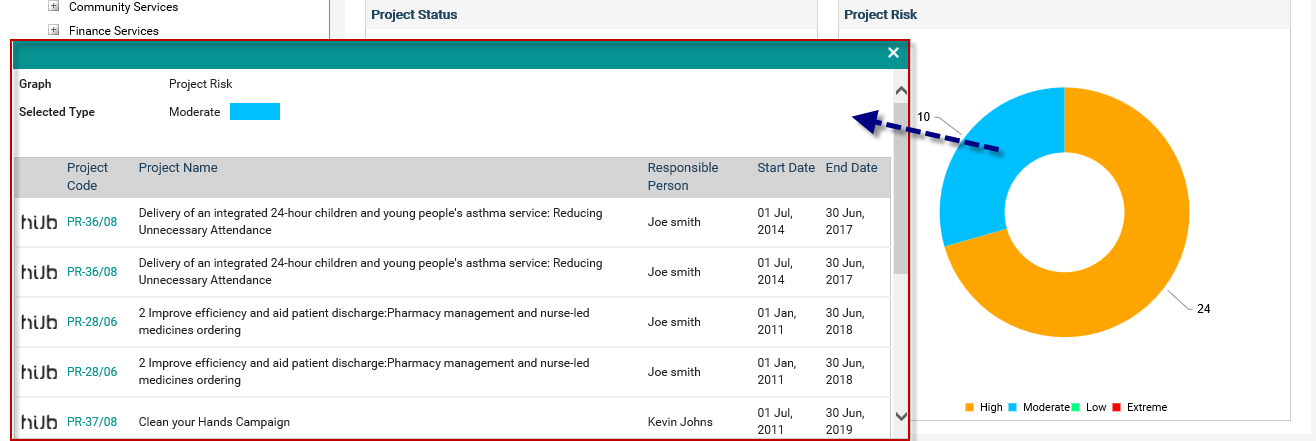
- Click on a section of the widget to view more details (The projects categorised as per the risk rating type). A grid will be displayed. Selected graph name and section are displayed on top of the grid.
- Project code is hyperlinked. Click on it to navigate to the project detail object within the workflow in a new tab.
- Click on the ‘Hub’ icon stated against a project to navigate to the area in a new tab. You will be navigated to the default hub area, which is configured via My Settings.
Project KPIs
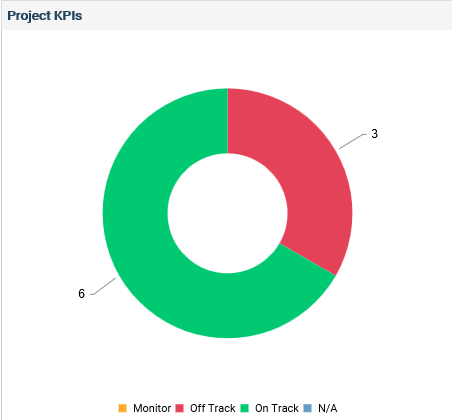
- KPI performance is derived from the ‘KPI Object’
- You can view the KPIs as a ‘Bar Chart’ or ‘Doughnut Chart’. You can set a relevant view by clicking on the ‘Edit’ icon. By default it will be shown as a doughnut chart.
- In the bar chart, the X axis displays the Types (On Track, Off Track, Monitor etc.)
- The Y Axis, indicates the percentage (or numbers, based on the selected filter options).
- Click on a section of the widget to view more details (The projects categorised as per the selected type). A grid will be displayed. Selected graph name and section are displayed on top of the grid.
- Project code is hyperlinked. Click on it navigate to the project detail object within the workflow in a new tab.
- Click on the ‘Hub’ icon stated against a project to navigate to the hub area in a new tab. You will be navigated to the default hub area, which is configured via My Settings.
- If the ‘KPIs’ object is not available in any of the project workflows, then the message “KPIs object is not configured in project workflows” will be displayed.
- If the ‘KPIs’ object is available in project workflows and no KPIs are added in the ‘KPIs’ object, then the message “There are no KPIs linked to projects” will be displayed.

Project Duration
Project Duration widget displays the duration of the projects.
- Project Duration is based on Start and End Dates (Timeframe field within the Project Details object) of the project. Holidays also will be included when calculating the project duration.
- Projects are categorised as per the following durations:
- More than 1 Year
- Within 1 Year
- Within 6 Months
- Within 3 Months
- Within 1 Month
- Within 1 Week
- N/A: Project duration is based on the Gantt. However, no tasks are available.
- You can view the duration as a ‘Bar Chart’ or ‘Doughnut Chart’. You can set a relevant view by clicking on the ‘Edit’ icon. By default it will be shown as a doughnut chart.
- In the bar chart, the X axis displays the Duration (More than 1 year, within 1 week etc.)
- The Y Axis, indicates the percentage (or numbers, based on the selected filter options).
- Project code is hyperlinked. Click on it navigate to the project detail object within the workflow in a new tab.
- Click on the ‘Hub’ icon stated against a project to navigate to the hub area in a new tab. You will be navigated to the default hub area, which is configured via My Settings.

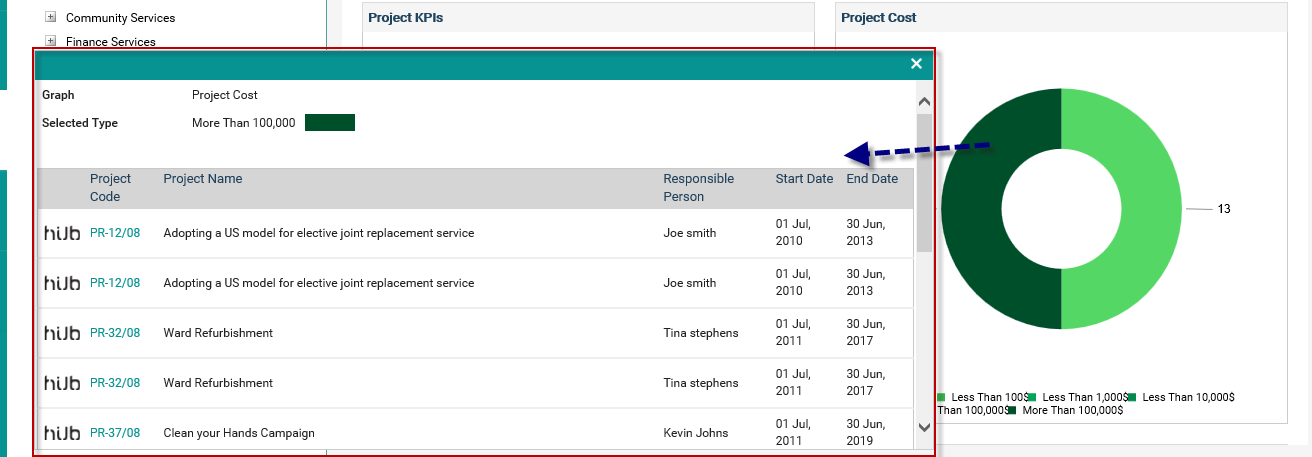
Project Cost
Project Cost widget displays the total expenditure of the projects.

- Project cost is derived from the ‘Total Expenditure’ budget type from within the ‘Preliminary Budget Object’.
- Projects are categorised as per the following standard categories:
- Less than 100,000
- More than 100,000
- Less than 10,000
- Less than 1000
- Less than 100
- Not Available – No data for total expenditure in preliminary budget object.
- You can view the cost as a ‘Bar Chart’ or ‘Doughnut Chart’. You can set a relevant view by clicking on the ‘Edit’ icon. By default, it will be shown as a doughnut chart.
- In the bar chart, the X axis displays the Expenditure Categories (More 10, 000, Less than 100 etc.)
- The Y Axis, indicates the percentage (or numbers, based on the selected filter options).
- Click on a section of the widget to view more details (The projects categorised as per the selected type). A grid will be displayed. Selected graph name and section are displayed on top of the grid.
- Click on the ‘Hub’ icon stated against a project to navigate to the hub area in a new tab. You will be navigated to the default hub area, which is configured via My Settings.
Project Total Effort
The Project Total Effort widget displays the total efforts for the projects.
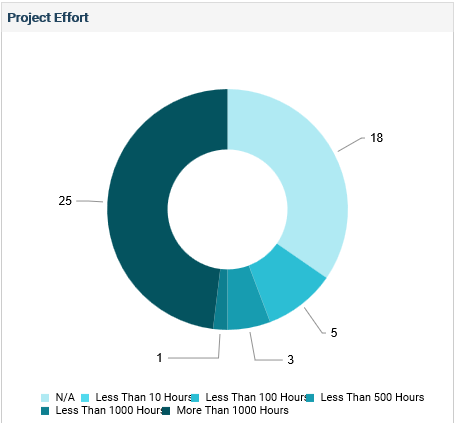
- Efforts will be derived from the total resource effort allocated for the project (in the Gantt area). However, ‘Holidays’ are excluded when calculation the total effort for the project.
- Projects will be categorised as per the following standard effort categories:
- More than 1000 Hours
- Less than 1000 Hours
- Less than 500 Hours
- Less than 100 Hours
- Less than 10 Hours
- N/A: No resource allocation for the project (as per the Gantt)
- You can view the total effort as a ‘Bar Chart’ or ‘Doughnut Chart’. You can set a relevant view by clicking on the ‘Edit’ icon. By default, it will be shown as a doughnut chart.
- In the bar chart, the X axis displays the Effort Categories (More than 1000 Hours, Less than 10 Hours etc.)
- The Y Axis, indicates the percentage (or numbers, based on the selected filter options).
- Click on a section of the widget to view more details (The projects categorised as per the selected type). A grid will be displayed. Selected graph name and section are displayed on top of the grid.
- Project code is hyperlinked. Click on it navigate to the project detail object within the workflow in a new tab.
- Click on the ‘Hub’ icon stated against a project to navigate to the hub area in a new tab. You will be navigated to the default hub area, which is configured via My Settings.

Editing Executive Dashboards
Click on the ‘Edit’ icon.

- The number of columns will be two for the bar graphs.
- For each widget, ‘On/Off Slider bar’ is available. Making it ‘Off’ will hide the particular widget from the dashboard. All widgets will be shown by default.
- Select the graph type. You can view the graph either as a ‘Bar Chart’ or ‘Doughnut Chart’. By default, all graphs will be shown as doughnut charts except for the ‘Project Progress’ graph which will be shown as a bar chart.
Overview Section
The executive overview section will provides a detailed summary of the projects for the selected hierarchy.

‘Overview’ tab will display below given information for projects:
Field | Description |
| Hub | Click on the 'Hub' icon to navigate to the default hub area in a new tab. |
| Project Code | Displays the project code for the project. Project Code is referred from ‘Project Ref’ field within ‘Project Details’ object. Project code is hyperlinked. Clicking Project code will navigate you to the Project Detail object within the workflow in a new tab. |
| Project Name | Displays the project title for the project. Project Name is referred from ‘Project Title’ field within ‘Project Details’ object. |
| Project Owner | Displays the project owner for the project. Project Owner is referred from ‘Owner field within ‘Project Details’ object. |
| Start Date | Displays the project start date. Start Date is referred from ‘Timeframe’> ‘From’ field within ‘Project Details’ object |
| End Date | Displays the project end date. End Date is referred from ‘Timeframe’> ‘To’ field within ‘Project Details’ object. |
| Team | Displays the service profile which the project is linked. |
| Project Category | Displays the project category for the project. Project Category is referred from ‘Category’ field within ‘Project Details’ object. |
| Progress | Displays the overall project progress for the project. The cell will be highlighted in the colour relevant to the project performance |
| Budget | Displays the overall budget progress for the project. The cell will be highlighted in the color relevant to the budget performance. |
Portfolio Project View
This area displays all projects and their tasks in a Gantt chart, enabling you to group by organisational hierarchy and create custom searches.
The default view would list all open projects ordered by their project code, and the Gantt view is collapsed to the project level. Parent projects would be at the top of the hierarchy and a option to expand and view the child projects if available.
Go to Executive Explorer > Portfolio Project View.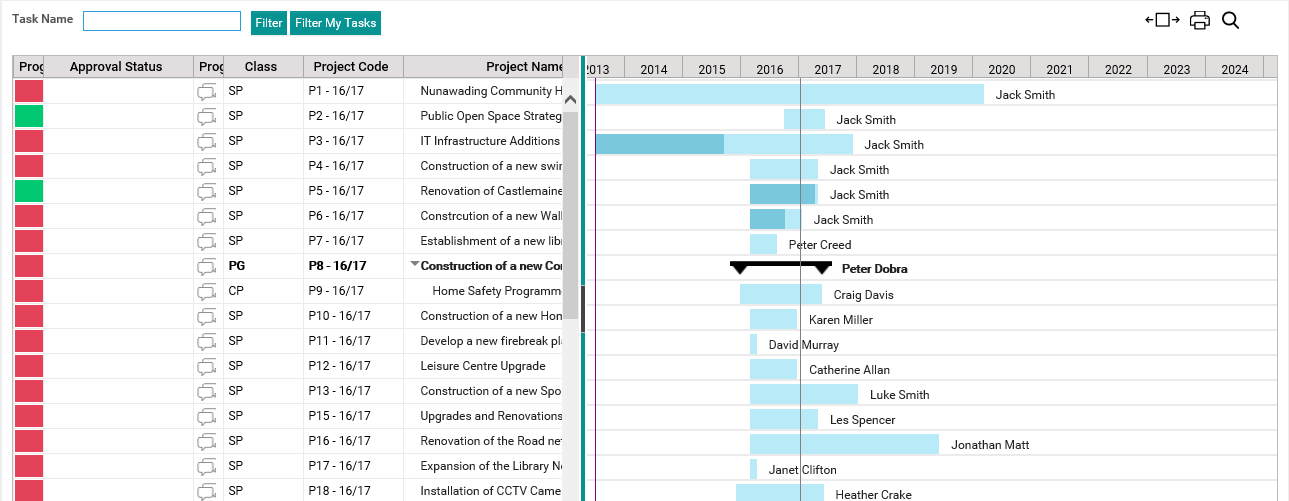
- The Project View displays all projects in the system grouped by project.
The Organisational View displays the projects grouped by organisational hierarchy. The hierarchy link is established from the service profile which was selected within the project's detail area.
Click the small arrows to expand or collapse a hierarchy.
An auto complete feature is available in the search box where a list of matching names will appear depending on the letters you type (please refer to screen shot below).
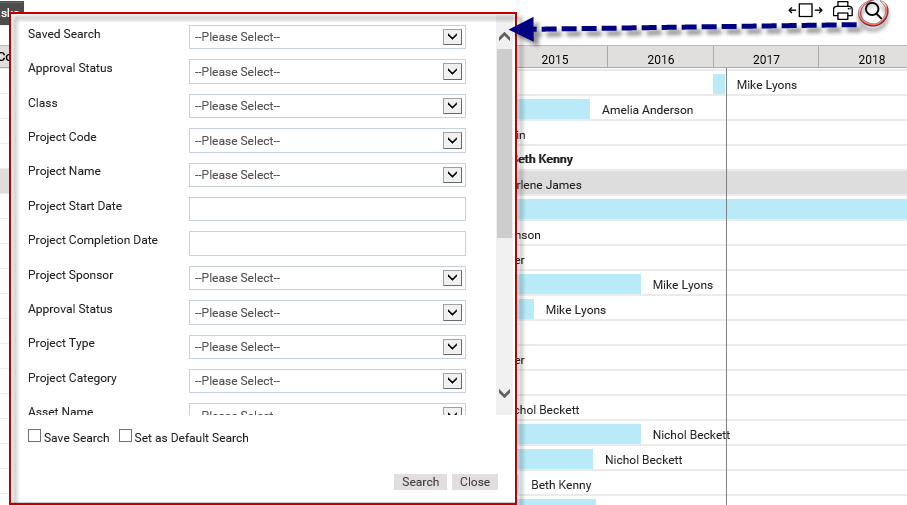
You can also click the time scale and scroll to the left to summarise the timescale and scroll to the right to expand the timescale.
Summarised Timescale

Expanded Timescale
Legend
Icon | Description |
| Search. Functions similar to the search option in Project explorer area (give a link to homepage customisation and advanced search) |
| Opens Print Options. |
| Project/task timeline |
| Projects/tasks in the critical path |
| Parent Project/Projects/tasks which have tasks/sub task linked to it |
| Milestone Tasks |
| Additional Comments. Click to expand or hover over to view the entire comment. |
Icons displayed in "Class" column | Each icon depicts a project class either parent , child or individual. These are defined in Project Settings > Project Class. |


Please refer the Business Rules for more information.
 | Once the rollover functionality is activated, the project progress is calculated based only on the current action progress even if the particular project is linked to both current and next period actions. |
Project Budget
The Project Budget area enables staff to select and prioritise projects considering the organisation's available budget. Please refer the project budget business rules for more information on budget status.
The system considers the projects based on whether they fit within the available budget. Even though the system streamlines the project selection process by ranking possible projects in order from the highest to lowest assessment score, staff will still have the ability to select projects that have lower scores for inclusion/approval.
At first glance, this page clearly indicates which projects can be included in the current year's budget along with other key information such as Overall Assessment Score, Approval Status, Total Project Budget and so on.
 | Some fields on this page may be activated or deactivated as per your organisation’s requirements. Please contact your System Administrator if you are unsure about the usage of any additional fields. |
You can filter the budget information by Project or Asset.
STEP 1: Select the 'Organisation' from the 'Projects From' dropdown.
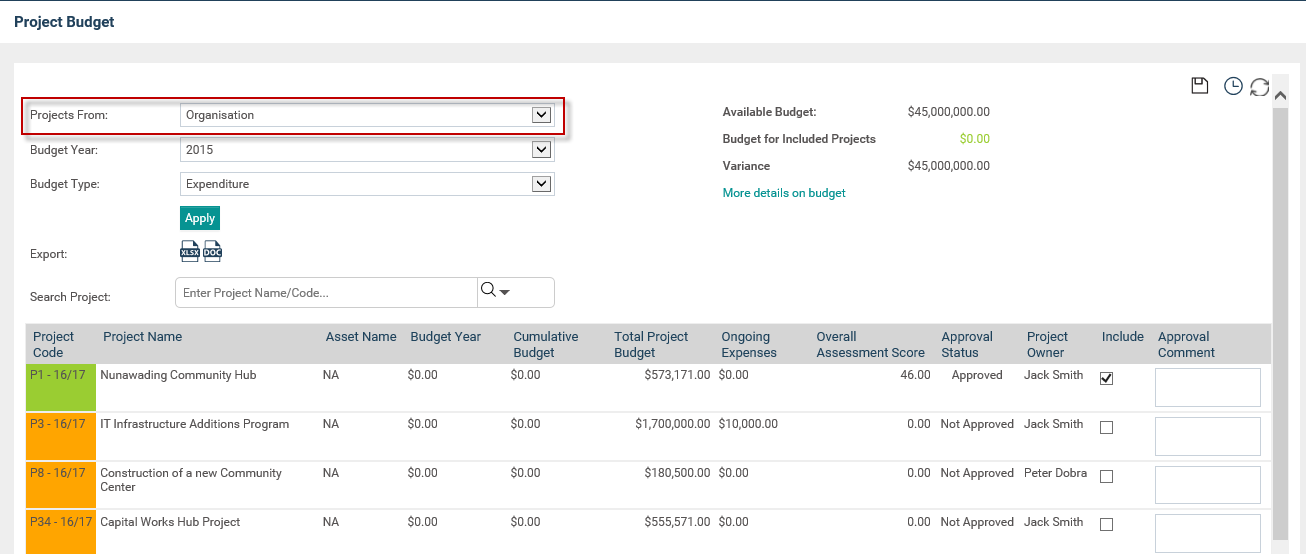
The following information will be displayed on top of the screen.
Field | Description / Instructions |
Projects From | You can view projects from either the organisation's or asset's point of view |
Budget Year | This drop down will help you to determine the available budget for a particular year |
Export | This feature helps you to export data to an Excel or Word file |
Available Budget | This will display the organisation budget available for the selected year |
Budget for Included Projects | Denotes the total budget of the included projects |
Variance | Denotes the difference between Available Budget and Budget |
The following column titles are provided within the Project Budget tab.
Field | Description / Instructions |
Project Code | As defined within the Project Details tab |
Project Name | As defined within the Project Details tab |
Project Asset | As defined within the Project Details tab |
Budget Year | Displays the budget amount that has been allocated for the selected year |
Cumulative Budget (e.g. 10/11 Cumulative Budget) | This will total the 10/11 budgets for each project cumulatively |
Totals Project Budget | Total expenditure for the project for all years |
Ongoing Expenses | Displays the Ongoing Expenses amount defined in IPM |
Overall Assessment Score | Score which is obtained from the 'Assessment model' |
Approval Status | Status of the project |
Project Start Date | As defined within the Project Details tab |
Project End Date | As defined within the Project Details tab |
Include | Ticking of the check box will enable you to include the budget to the organisation |
FTE | Total FTE allocated for a project |
STEP 2: Select the 'Asset' from the 'Projects From' drop down.
STEP 3: Select the particular asset from the 'Asset tree view'. All projects under the selected asset are displayed and are grouped by Asset level.
Resource Allocation
This section allows you to view the allocation of resources across your organisation's projects using the Project Board and Team Object and the additional Resource Allocation functionality.
When this functionality is active, an additional area is made available within the Project Board and Team object which lets you identify a staff member's involvement in the current project in terms of FTE which stands for Full-time equivalent. An FTE of 1.0 means that the person is equivalent to a full-time worker, while an FTE of 0.5 signals that the worker is only half-time.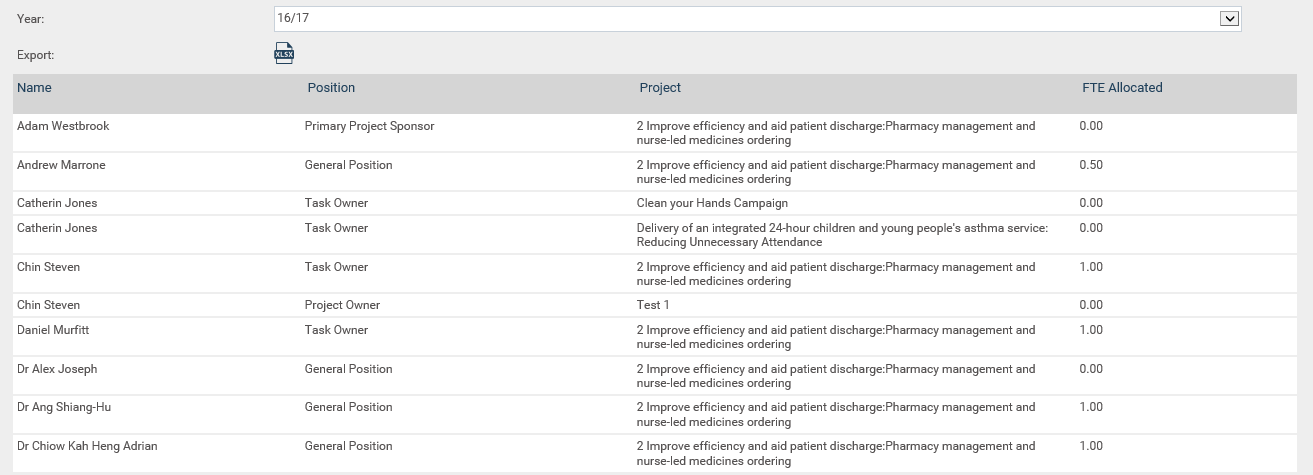
This page displays the current year's resource allocation by default but you can use the dropdown to view a different reporting year.
You can choose to export this data into a spreadsheet by clicking the EXPORT button.
Financial Target
The Financial Target displays targets that are defined for a financial year.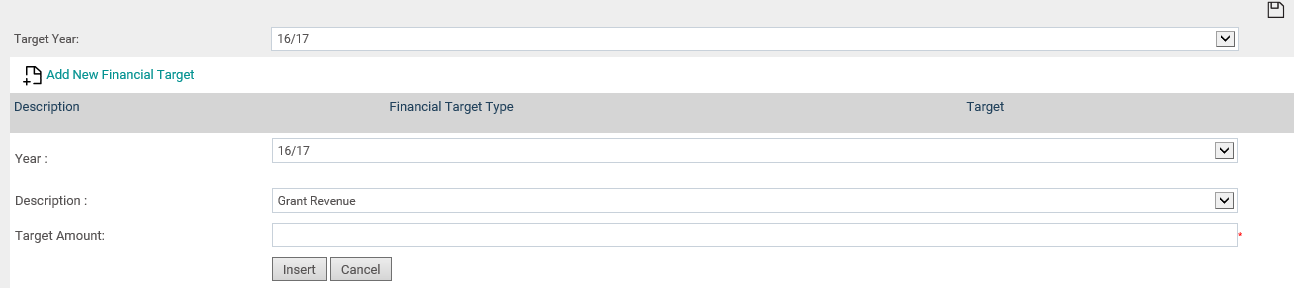
To set new financial Target;
STEP 1: Specify the following details.
Field | Description / Instruction |
Financial Target | Specify the amount in dollars |
Year | Dropdown allows selection of existing system periods; defaults to current period |
Description | Drop down allows selection of a description; These descriptions are defined within Settings Configuration > Preliminary Budget Line\Budget Type area |
Target Amount | Specify a target amount in dollars |
STEP 2: You can filter the financial target information by selecting the relevant target year from the 'Target Year' drop down.
All the financial target details can be modifiable.
 | IPM Administrator can create financial targets through Framework> Project Settings> Organisational Budget area as well. |
Project Overview
The overview area provides a "snapshot view" of project performance in the form of four pie charts; one each for project progress, project expenditure, duration and total effort as shown below:
The information shown will be based on the search criteria chosen by you within Framework> Project Settings area.

When you hover above a particular section, it will display the number which is indicated by that share,

When you click on a particular section (i.e clicking the section which indicates the 'N/A' in project cost will open a table indicating the projects with N/A cost with columns such as Project code, Project Name and Cost) of the Pie chart, a table indicating the summary view will appear. Click on the 'Back' button to navigate back to the Pie chart view.
Below is an example of a summary which will appear when you click a particular section of the pie chart.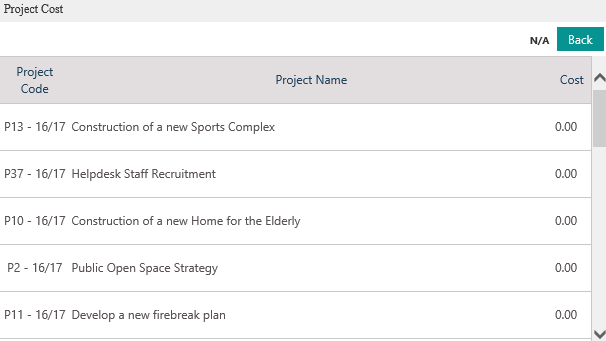
The below table provides an insight to each of the Pie charts.
Progress Performance | This Pie chart Indicates the overall progress of the organisations' projects categorised as 'On Track, Off Track, Monitor and N/A. Clicking a section of the pie chart will display a detailed view indicating project code, name, project owner and start/end date. |
Project duration | This Pie chart displays the duration of all the organisation projects. Duration range is based on overall start and end dates of the projects such as 'within 1 week, within 1 month, 3 months' etc. Clicking on a section of the pie chart will display a detailed view indicating the projects which falls during the selected duration (project code, project name, start and end date with the total duration is indicated) |
Project Cost | This Pie chart indicates the total expenditure of all projects. The values are obtained from ‘Expenditure’ section in preliminary budget object. Clicking a section will display the projects which fall under the particular expenditure range. Project code, name and total expenditure is displayed in the detailed view. |
Project Total Effort | This Pie chart indicates the total efforts for overall projects. Clicking a section will give a detailed view of projects which falls under the particular range. Project code, name and total effort is indicated. |
You can use the 'Filter' option given on top right corner in order to refine the information which you wish to be displayed. Simply click on the 'Search' button and the below screen will appear.
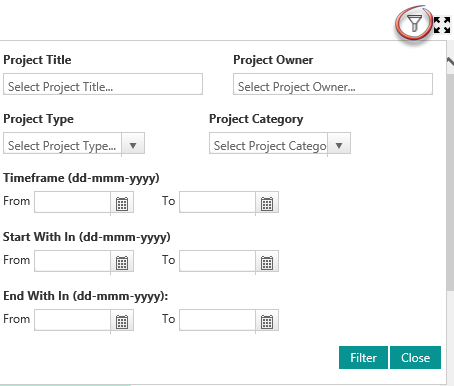
Below table gives an overview of the search criteria,
Project Title | Search as per the project title. This box has auto fill facility which will enable you to locate the project conveniently. |
Project Owner | Search as per the project owner. This box has auto fill facility which will enable you to locate the project owner conveniently. |
Project Type | The dropdown will enable you to choose the project type. |
Project Category | The dropdown will enable you to choose the project category. |
Time Frame | Can search using the time frame in which the project falls into. |
Start With in | Can search by using a range of dates to locate the start date of the project. |
End With in | Can search by using a range of dates in which the end date of a project falls into. |
Project Charts
The Project Chart View will display a chart view of all the Organisation Projects.

You can click on the 'Cog wheel' icon on right top corner next to the search icon in order to configure different orientations for the visibility of the chart.

You can click on the 'Filter' icon and refine the criteria in order to filter the data as required.

The filters of the search box is as below:
| Project Title | Search as per the project title. This box has auto fill facility which will enable you to locate the project conveniently. |
| Project Owner | Search as per the project owner. This box has auto fill facility which will enable you to locate the project owner conveniently. |
| Project Type | The dropdown will enable you to choose the project type. |
| Project Category | The dropdown will enable you to choose the project category. |
| Time Frame | Can search using the time frame in which the project falls into. |
| Start With in | Can search by using a range of dates to locate the start date of the project. |
| End With in | Can search by using a range of dates in which the end date of a project falls into. |
Note: Limitations when viewing the graph.
The graph cannot display both Target/Actual for progress as well as your YTD Budget and Actual on the same graph because the scales for the parameters for each item are different.
For example, the X Axis on the top of the graph is showing the Target/Actual % (and doesn’t actually show these values on the graph because the scale has been blown out for the X Axis of the Budget (at the bottom). Hence, there is a large YTD Budget and Actual. You will only be able to view the YTD Budgets on a separate graph to the Projects Target and Actual.
Project Milestones
The Milestones area allows you to view all projects which have task milestones defined. The information will be displayed as per the search criteria.

The Legend

Legend | Description |
Project Start Date | This will indicate the start date of the project in the chart |
Milestones | This will indicate the Milestones of a project |
Milestones Completed | This will indicate the completed Milestones of the project |
Milestones Overdue | This will indicate the Overdue Milestones of a project |
Project End Date | This will indicate the end date of the project |
You can filter the projects which are displayed using the 'search' box which will appear by clicking the 'search' button on top right corner of the screen.

The filtering criteria for each of the elements in the search box is as below,
Filter | Description |
Project Title | Search as per the project title. This box has auto fill facility which will enable you to locate the project conveniently. |
Project Owner | Search as per the project owner. This box has auto fill facility which will enable you to locate the project owner conveniently. |
Project Type | The dropdown will enable you to choose the project type. |
Project Category | The dropdown will enable you to choose the project category. |
Time Frame | Can search using the time frame of the project. . |
Start With in | Can search by using a range of dates to locate the start date of the project. |
End With in | Can search by using a range of dates in which the end date of a project falls into. |