Creating a Dashboard
To create a new dashboard, click the “+” icon from the left menu. This will ask you to select a pre-set layout from the pop-up which directs you to the Dashboard Designer page.

NOTE: You can always add, resize, move and remove tiles from the pre-set layout when designing your dashboard.
The Dashboard Designer page allows user to
- Select a pre-set layout
- Add report parts to a dashboard
- Customize dashboard layout
- Edit dashboard description and background
- Copy and move dashboard
- Switch to presentation mode
- Configure sharing access
- Add subscriptions and scheduled delivery
- Print dashboard
- Email dashboard
- Dashboard filters
Initially a preset layout needs to be selected in order start creating your dashboard.

Now you can opt to either create a “text” dashboard tile or include an existing report part in each one.
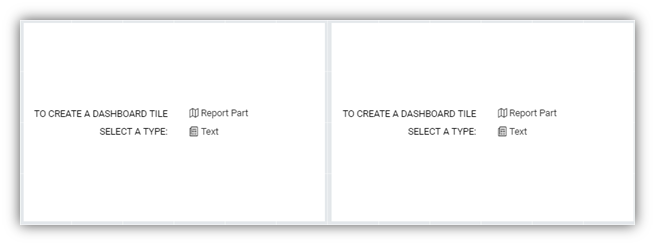
For a “text” dashboard tile, switch to the Configuration mode (page flip) icon to input the content.

- Optionally enter a title and description.
- Click the gear icons (⚙) to format the title and description. The title and description are limited to one paragraph of text and simple formatting:
- font face and font size.
- text effects bold, italic, underlined.
- font color and background color.
- text alignment.
- Enter the content into Body Text. This section supports unlimited amount of text and more formatting options:
- Bullet List and Numbering List.
- Indented text.
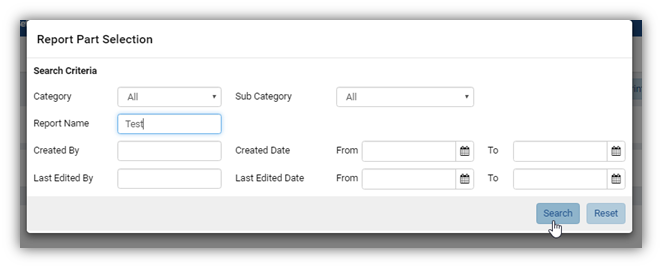
For the existing report part option, use the Report Part Selection pop-up to search and use an existing report part:
- Optionally specify a report category or sub-category.
- Type a partial text in Report Name to search for the existing report first.
- Other search options include Created By, Created Date, Last Edited By and Last Edited Date.
- Click Search to see the list of matching reports.
- Select a report to display the list of its report parts.
- Select the report part you want to use within this Dashboard and click OK to use it.
Repeat for other tiles then click Save at the top to save the dashboard.
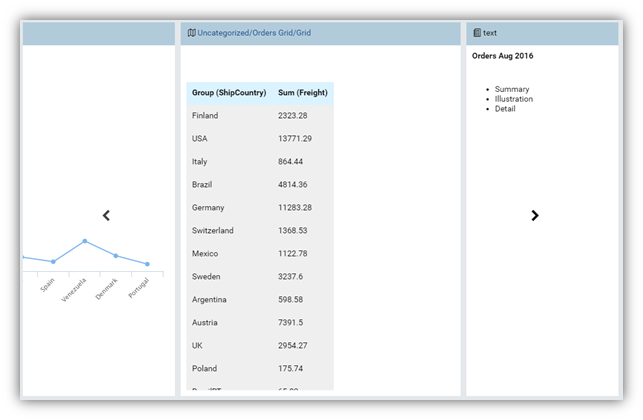
Following is a sample dashboard with 3 tiles: a comparison column chart, detail grid and a text part for the summary:

Customize Dashboard Layout
The dashboard tiles can be added, copied, resized, moved around, swapped in position and deleted.

Move the cursor over the title bar to see Copy, Configuration/View mode, Full screen and Delete buttons.
- Switch the tiles back to View mode to be able to change the layout.
- Place the cursor over the edges of dashboard tiles then click and drag to resize them.
- Move the cursor over the title bar then drag to move the tiles.
- Drag a tile onto another to swap them.
- Click the Add Dashboard Tile button at the top to insert a new tile at the end.
Edit Dashboard

The Edit menu allows users to:
- Set a description for the dashboard.
- Set background colour.
- Set background image:
- Select Set Background Image to open Background Image Settings pop-up.
- Enter the url of the image.
- Choose to stretch or centre the image.
- Click OK to close the pop-up.
A unique feature of Dashboards is that it allows you to switch to Presentation mode.
Click the Presentation button at the top to switch to Presentation mode.
- In this mode, each dashboard tile takes turn being displayed for a configurable time.
- The sub toolbar allows users to configure the slide transition time and switch to full-screen.
Note: Using report parts with short data refresh intervals together with presentation mode in full-screen can effectively make up a live slide show dashboard.
Configure Sharing Access
- Click the Access button at the top to open the Access screen.
- Click the Add Sharing button to add a new share.
- Select either Everyone, Role, or User from the Share With drop-down.
- For Role or User, select a specific one from the drop-down.
- Select a permission from Access Rights drop-down (See details in List of Access Rights table below).
- Click Save at the top to save the selections.

List of Access Rights | ||||||
Interact with shared report | Full Access | Save As | Locked | View Only | No Access | |
View the dashboard with filter interaction | ✔ | ✔ | ✖ | ✔ | ✖ | |
View the dashboard with NO filter interaction | ✖ | ✖ | ✔ | ✖ | ✖ | |
Save changes in the dashboard | ✔ | ✖ | ✖ | ✖ | ✖ | |
Save As changes in the dashboard | ✔ | ✔ | ✖ | ✖ | ✖ | |
| ||||||
Access Right | ||||||
Full Access | ||||||
Save As | ||||||
Locked | ||||||
View Only | ||||||
No Access | ||||||
Another function of this screen is to change the Dashboard Owner (next to the dashboard name):
- Click the plus icon to open All Users pop-up.
- Select either User Name, Email Address or Role to search for. Select All to search for all fields.
- Type a partial name into the search box and click the search icon ( )
- Only matching users will be displayed.
- Select the user then click OK to close the pop-up.
- Click Save button at the top to save the dashboard together with the owner.
Subscriptions, Email and Scheduled Delivery
These features work the same way as for Reports.
Dashboard Filters
The filter section on the dashboard will only show common filters between ALL report parts used in the dashboard.
- By default, common filters are defined as the same field from the same table in the same schema of the database utilising the same filter operator. This definition can be modified by your Insights Administrator.
- Stored procedures used in reports follow the same logic as above.
- Any filters which are not common between all report parts are available on the back of the report part tile. The user can flip the tile and update results to change the filters for the specific report part.
- Common filters query only one instance of a common filter (the first one in the dashboard), for data driven filters (checkbox, selection, tree, popup style filters where the user is presented data for selection). This means when Field A is common, based on rules set above, only the first instance of the field which is common will be queried to pull results for common filter data.
- Common filter order in the dashboard is set by the top most left dashboard tile. The filters associated with this report will be used to set the order. This order will update when a new tile is added, a tile is removed, and on saving the dashboard. The order is not recalculated as tiles are moved around on the dashboard.