- The hierarchy summary component is mandatory to configure the drill-down of your dashboard. When a hierarchy summary component is added on to a page, it will show the hierarchy nodes that are linked underneath (the next hierarchy level). Hence, hierarchy summary should be repeatedly used in order to show the drill down of the dashboard as it’s setup in Camms.Strategy.
Configuring the Hierarchy Summary component
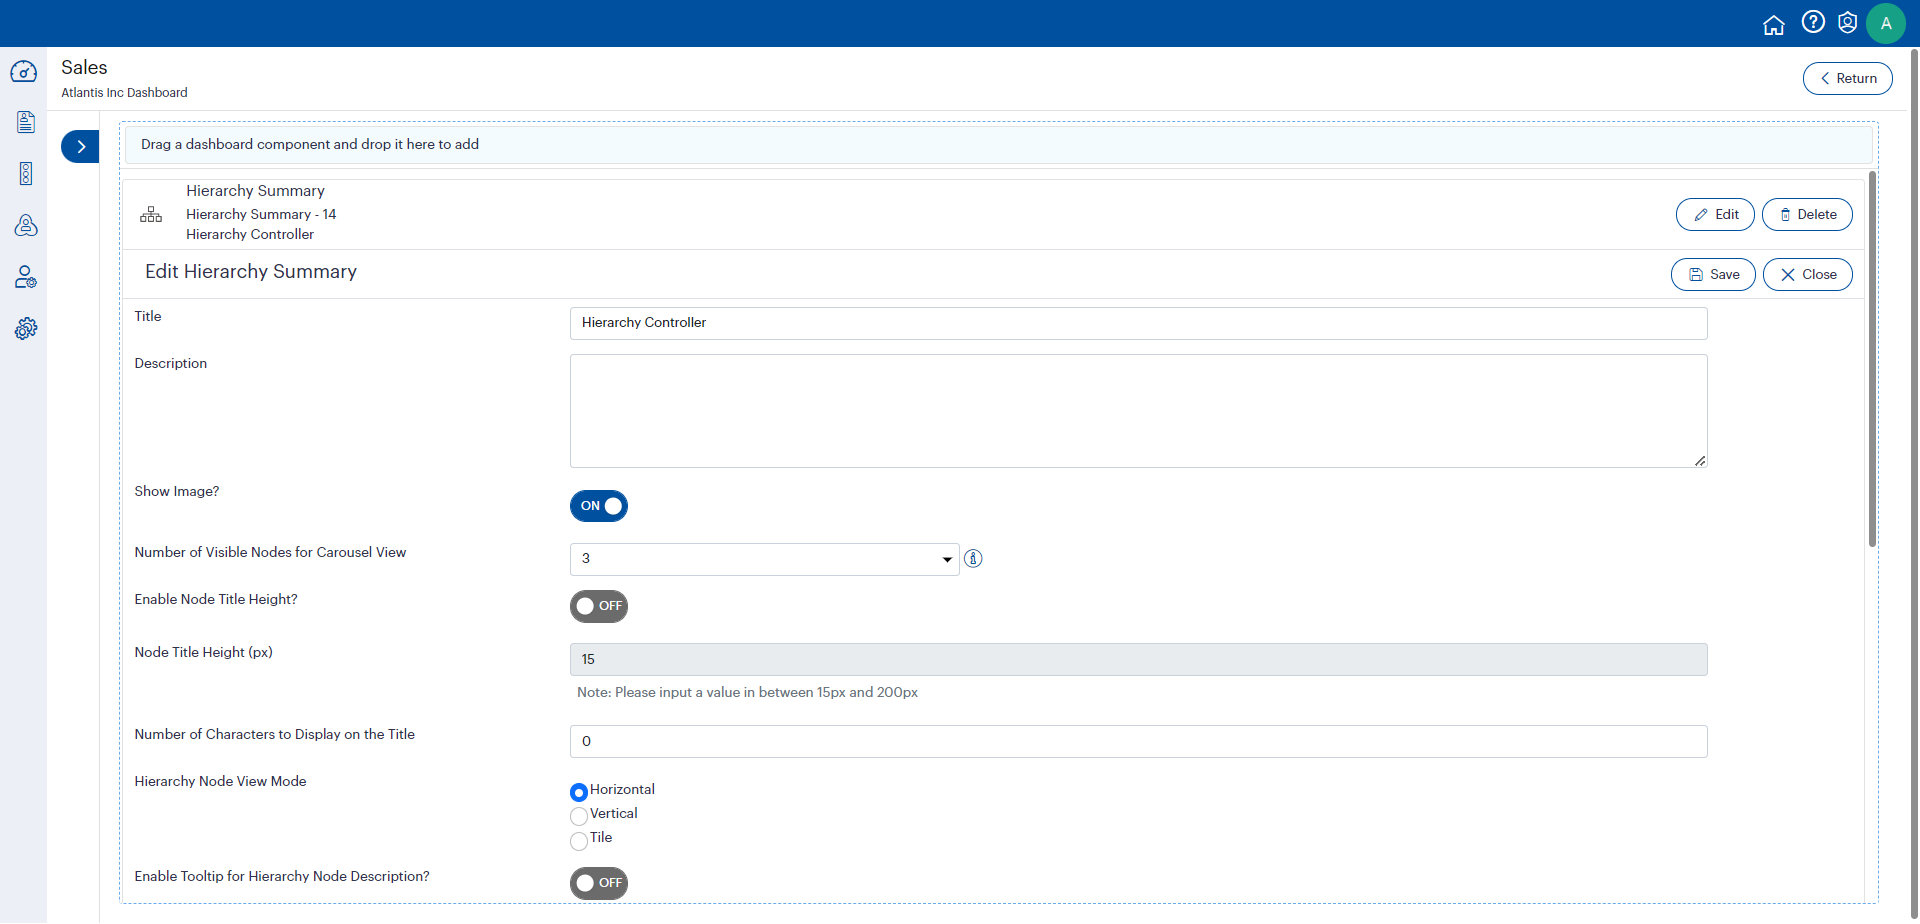
- Once the component is dropped on to the page design section, click edit to enable the configuration mode.
- Title – Title will be displayed on the dashboard as a button, and you have the flexibility to edit the name, as it will then display on the dashboard.
- Description – You can add a description to your hierarchy summary which will be displayed on the dashboard.
- Show Image? – This toggle button is placed to control the visibility of node images in the hierarchy. It will be disabled by default. If you enable this toggle button, you will be able to see the node images added in the hierarchy summary.
- Number of Visible Nodes for Carousel View – You can configure the number of nodes to be displayed on the dashboard home page.
- Enable Node Title Height – This toggle button is placed to control the size of the node titles, once enabled you will be able to give a size for the node title.
- Number of Characters to Display on the Title – You can define the number of characters to be displayed for the hierarchy node name.
- Hierarchy Node View Mode – You can select a view mode of hierarchy nodes to be displayed on the dashboard home page.
- Enable Tooltip for Hierarchy Node Description – This toggle button will enable the tooltip for the description of the hierarchy nodes. Once enabled, Tool tip “Description” will be displayed when you hover over the description of the Hierarchy nodes.
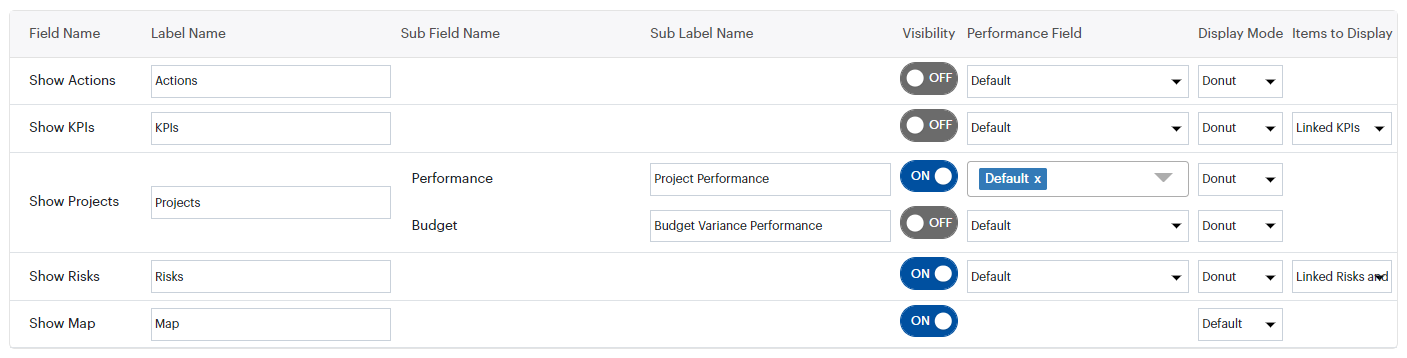
- You can configure the summary components to be shown through the above configuration grid.
- The project section would have two sections:
- Project Performance Section
- Only for the Project Performance's 'Performance Field' you would be able to enable the 'Visibility' toggle button of any number of Performance RAGs in the configuration menu of the Hierarchy Summary.
- You would have the option to either configure the default and custom RAGs manually or select all of them at once using the 'Select All' checkbox.
- The Search functionality has been enabled as well so that you would be able to search for a RAG by its name.
- Budget Variance Performance Section
- Project Performance Section
- Field Name – These names would refer the original names of the hierarchy summaries.
- Label Name – You could add a label name to be displayed on the dashboard, as per your requirement.
- Sub Field Name – You could add a label name for each Project section, to be displayed on the front end of the dashboard.
- Sub Label Name – You could add your own label name for the sub fields as well.
- Visibility – The visibility toggle button will be kept disabled by default. If you want the summary to be displayed on the dashboard, you should enable it.
- Performance Field – This would refer to the performance fields added in your CAMMS product suite. The default would always refer to the default performance indicator. If you have any custom RAGs configured in your CAMMS product, you could use the RAG options placed in the configuration field to extract the performance summary against each item.
- Display Mode – You could select the mode to display the summary from the dropdown as ‘Legend’, 'Column' or ‘Donut’ mode. For the Map the options would be 'Default' and 'Inline', wherein 'Default' would showcase the Map below the Actions, KPIs, Projects and Risks Summaries, whereas 'Inline' would showcase the Map, right aligned and in line with the Summaries.
- Items to Display – You can select which items should be displayed in the summary, either directly linked items to the node or items linked to projects as well. (Ex: linked KPI s, Linked KPIs and Project KPI s, Project KPI s)
Notes:
- The 'Performance Field' column would be set to 'Default' Project Performance option within the multi-select dropdown.
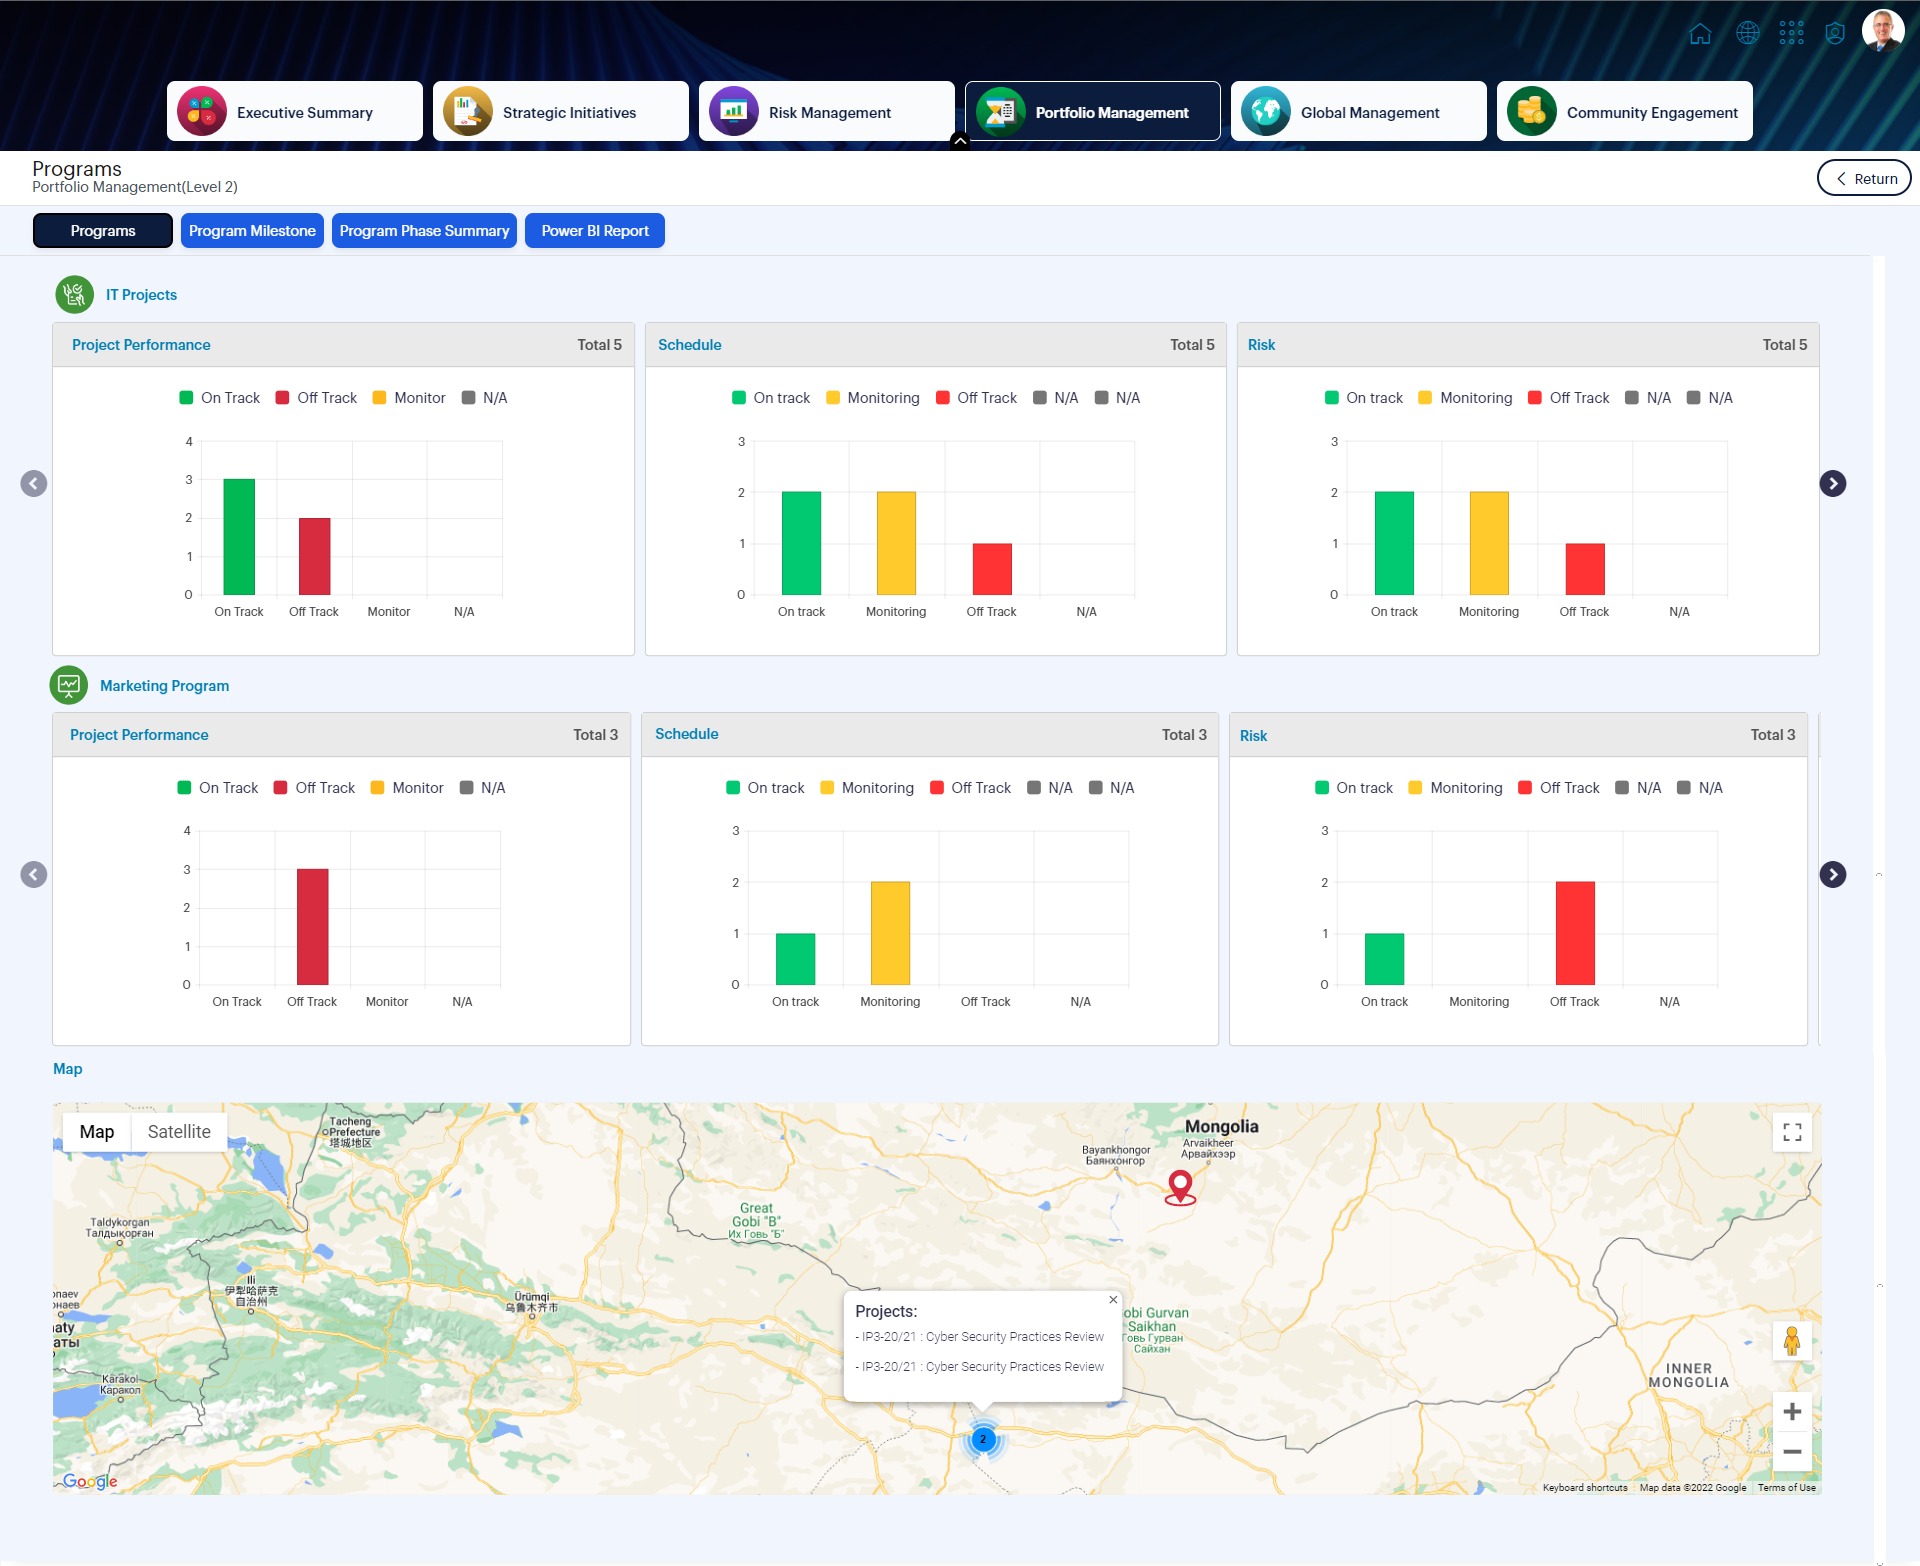
- Once the field map is enabled it will show you a map view on your dashboard with all the locations of actions and projects. (Locations will be shown only if you have entered them in Camms.Strategy and only if you have enabled the visibility toggle button of actions and projects in performance summary grid.
- The configuration grid would enable components to be displayed in the final summary view as depicted in the first image.
- When you scroll down through the Hierarchy Summary Component, you will see all the level 2 nodes of the selected hierarchy.
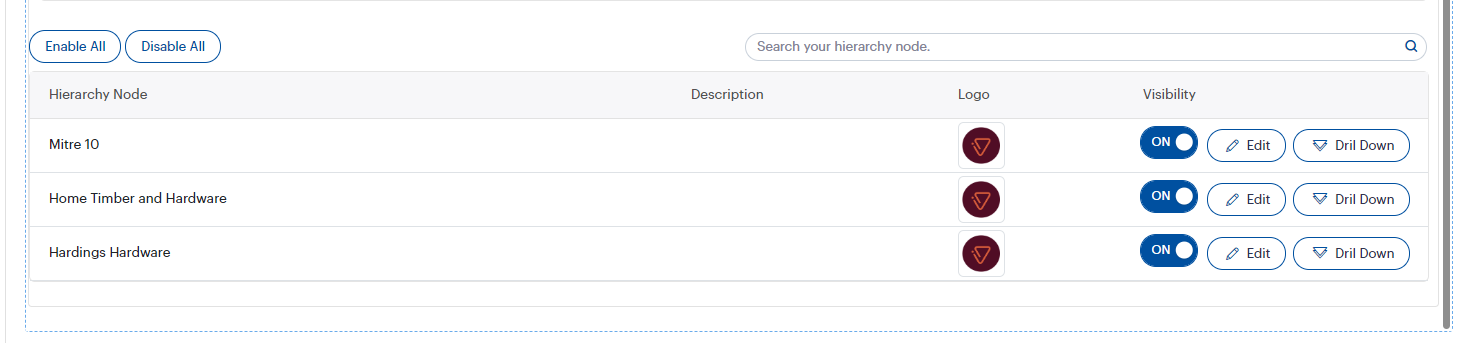
- Configuring the hierarchy nodes – In order to configure the hierarchy nodes, you can click the edit button placed in the right corner which enables an editable view. The hierarchy summary grid enables for in-line editing.
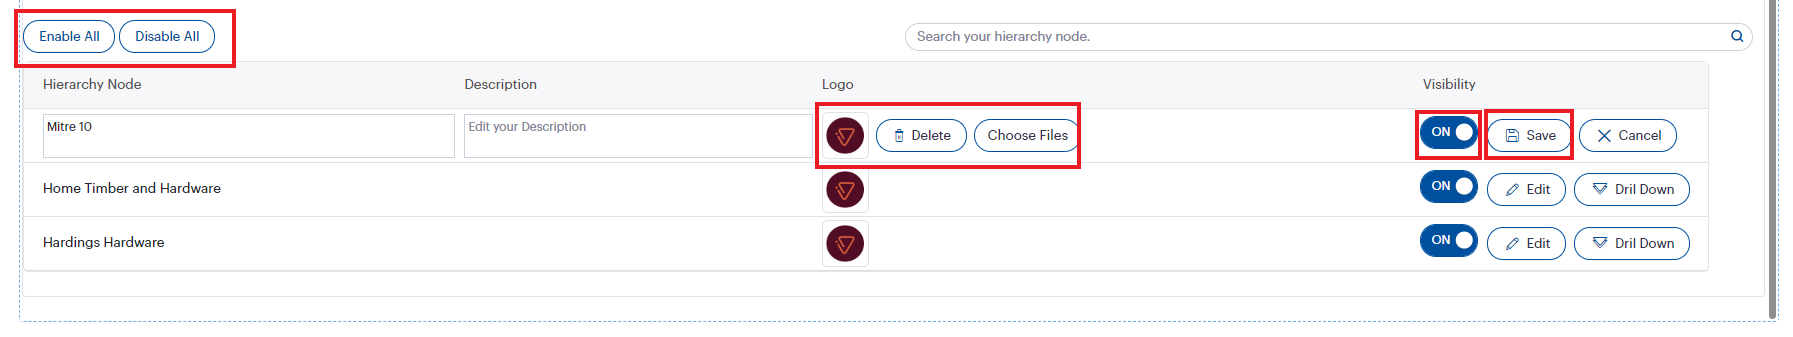
- Hierarchy Node – Displays the name of hierarchy nodes added in Camms.Strategy. You could edit the name of hierarchy node if you require.
- Description – You could add a description against a hierarchy node. However, this will be visible when you hover on the node.
- Logo – You could upload an image for a node from your local drive if you click on the choose file button. If you want to delete the current logo image, you can click on delete button as well. (The recommended file format is PNG)
- Visibility – The visibility of the hierarchy nodes in the dashboard can be controlled via this check box. If you check the visibility box, that particular hierarchy node will be displayed on the dashboard. However, it will be disabled by default.
- Once, all the required data is entered, you could click on the save button placed at the right corner of the row. Likewise, you could configure rest of the hierarchy nodes from the hierarchy summary component and click save to apply these additions on the dashboard.
- If you want to enable or disable the visibility of all the nodes at once, without configuring them one by one, you can click on 'Enable all' or 'Disable all' buttons respectively.
- Important Note: In order to configure your dashboard through the hierarchy drilldown, you have to click on the 'Drilldown' button placed at the right corner of your hierarchy node which will then take you to the next level of the hierarchy.
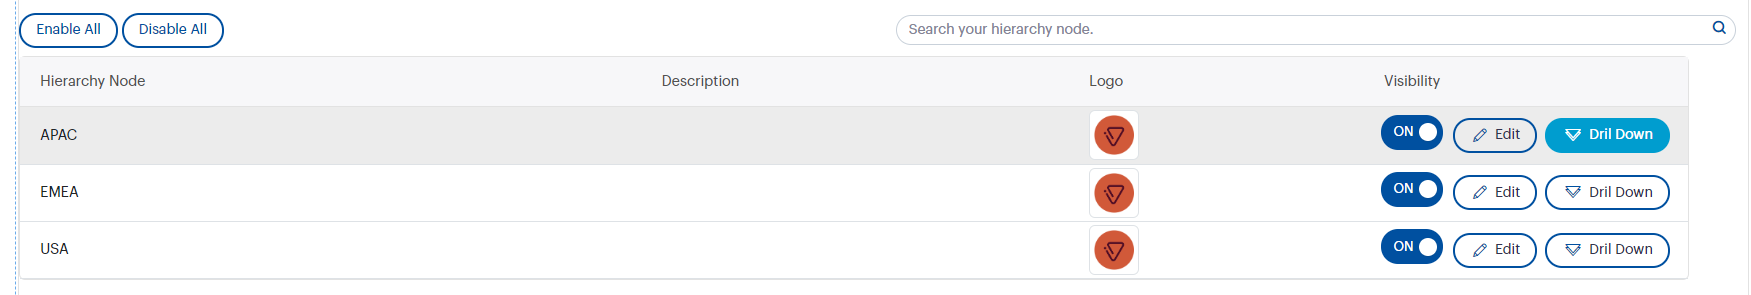

- The breadcrumb placed above will indicate where you are configuring in the dashboard hierarchy. Similar to the Level 2 configuration, you could drag and drop components from ‘Dashboard Components’ section on to ‘Page Design’.