- This component will display all the KPI s linked to a particular node in a node view.
- The Actual, Target, Forecast and Benchmark values will be fetched from Cammsstartegy against defined time period. (Time period will be defined at the creation phase of the dashboard.)
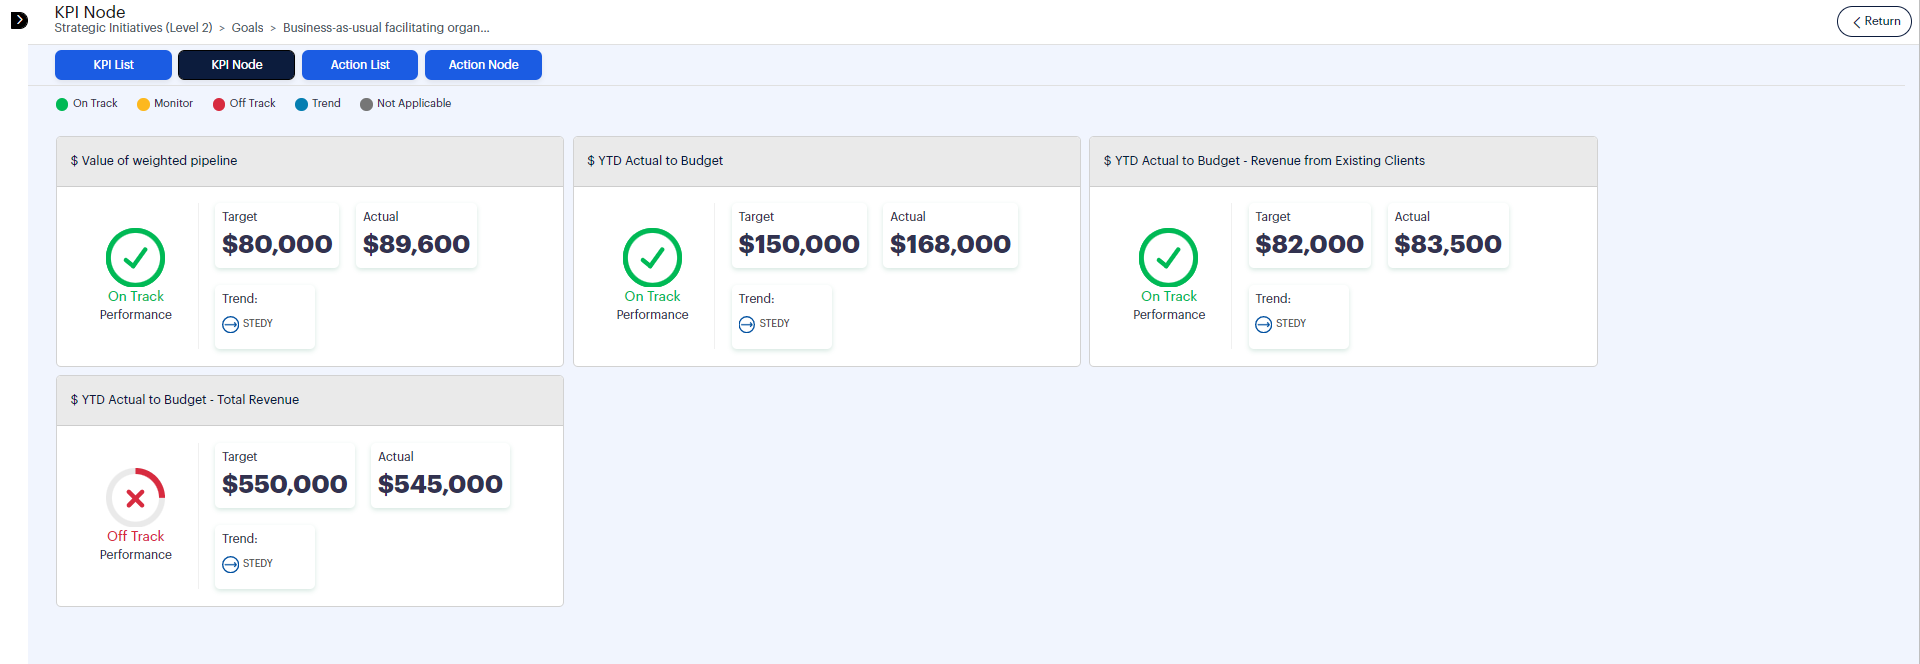
- Dashboard View of KPI Node will be as follows:


Configuration of KPI Node Component

1. Title – you can add a title to the KPI Node component.
2. Description – you can add a description to the component, which will be displayed above the component on your dashboard.
Note: All the KPIs which are linked to the node will be listed here.
3. Template – You can select one of the KPI templates to display the KPI Nodes in the dashboard
4. Layout – You can select the view mode of the KPI nodes to be displayed on the dashboard, either ‘carousel’ or the ‘tile’ view.
5. Number of Visible Nodes for Carousel View - You can select the number of nodes to be displayed in the dashboard and the maximum number of nodes that can be configured is 6 whereas the minimum is 1.
6. Number of Characters to Display on the Title – You can define the number of characters to be displayed for the KPI name.

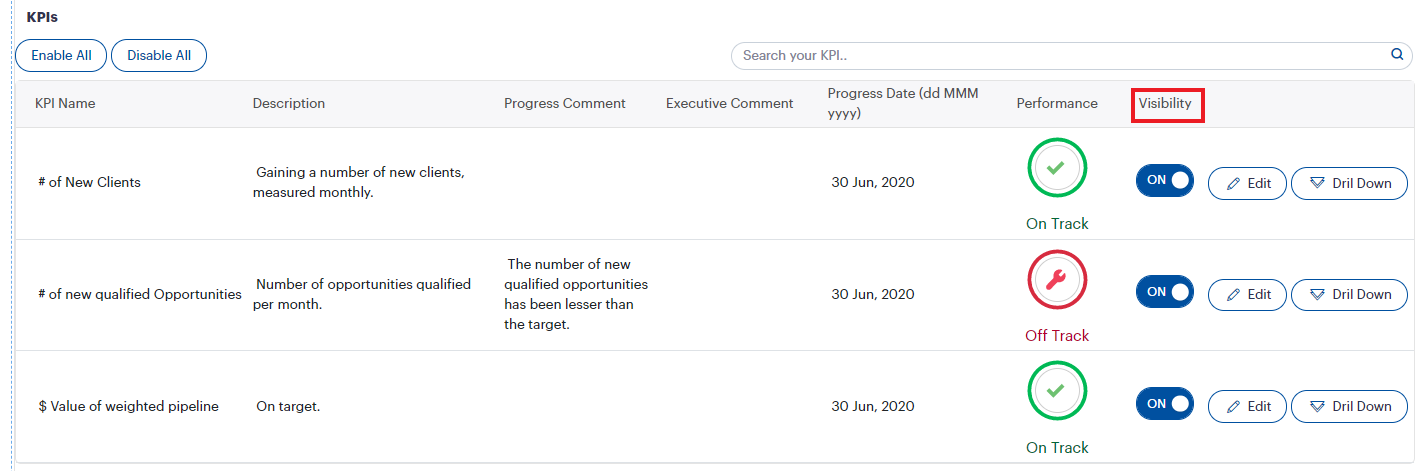
- Search Bar - You can search for a KPI by entering text on the type in search bar placed about.
Note: You can edit KPI by clicking on the edit icon placed at the right corner of each KPI.
- KPI Name – this refers to the KPI name added in Camms.Strategy. You can edit the name of the KPI on the KPI Node configuration grid.

- Description - This refers to the KPI description added in Camms.Strategy. You can edit this on the KPI configuration grid.

- Progress Comment - the progress commentary is coming through from Camms.Strategy for the given date. the comment could be seen by either the logged in user or by the external user based on the configuration of the Administrator. The comments can be edited on the grid.

- Executive Comment - the executive comments are taken from the executive report selected at the dashboard creation phase and will display the comments added against the selected KPI on the executive report selected.

- Progress Date - You can setup a custom performance date (besides the global performance period setup at the dashboard creation phase) for individual KPIs. This will show you data within the period which includes the given date. Regardless of the date that the user selects the 'Actual' and 'Target' values will be fetched from the last completed (last closed) period. However by selecting the last date of the period of a KPI the user can display the 'Actuals' and 'Targets' of the current period.

- Performance - The performance gauge will show actual figure of the KPI according to the period which includes the given progress date. It will differ as you change the progress date for the KPIs. The same actual figure along with the performance status will be displayed on the dashboard.

- Visibility- You have to Enable the visibility toggle button to show the KPI on the dashboard. The toggle button is disabled by default.
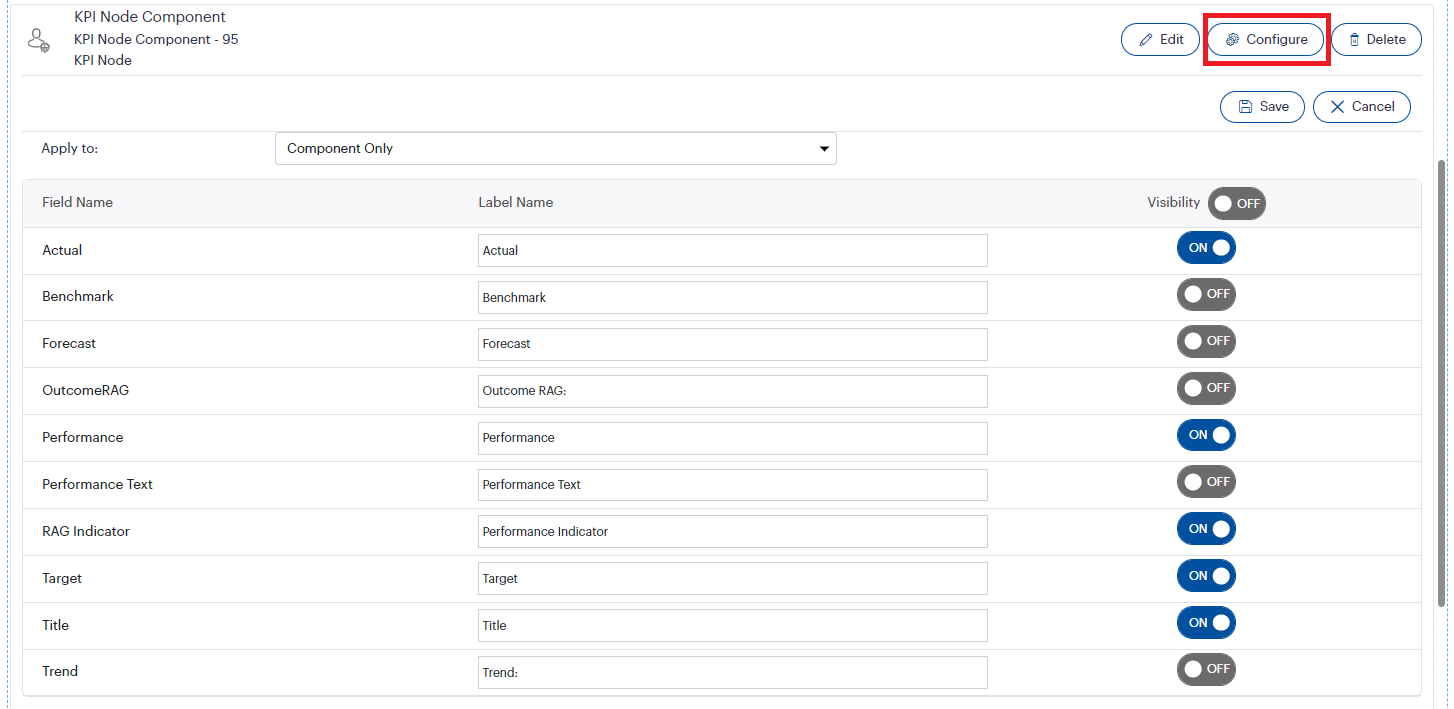
- You can configure the fields to be shown on the ‘KPI Node’ of your dashboard by clicking on the configure icon of the ‘KPI Node’ component.
- Field Name - refers to the field name in Camms.Strategy.
- Label Name – refers to the field name to be displayed on the dashboard, you can edit this as per your choice.
- Visibility – enable the visibility toggle button to make the fields visible on the dashboard. The toggle button will be disabled by default.
- You can click on the drill down icon against each KPI to configure the detail level components for the KPIs.
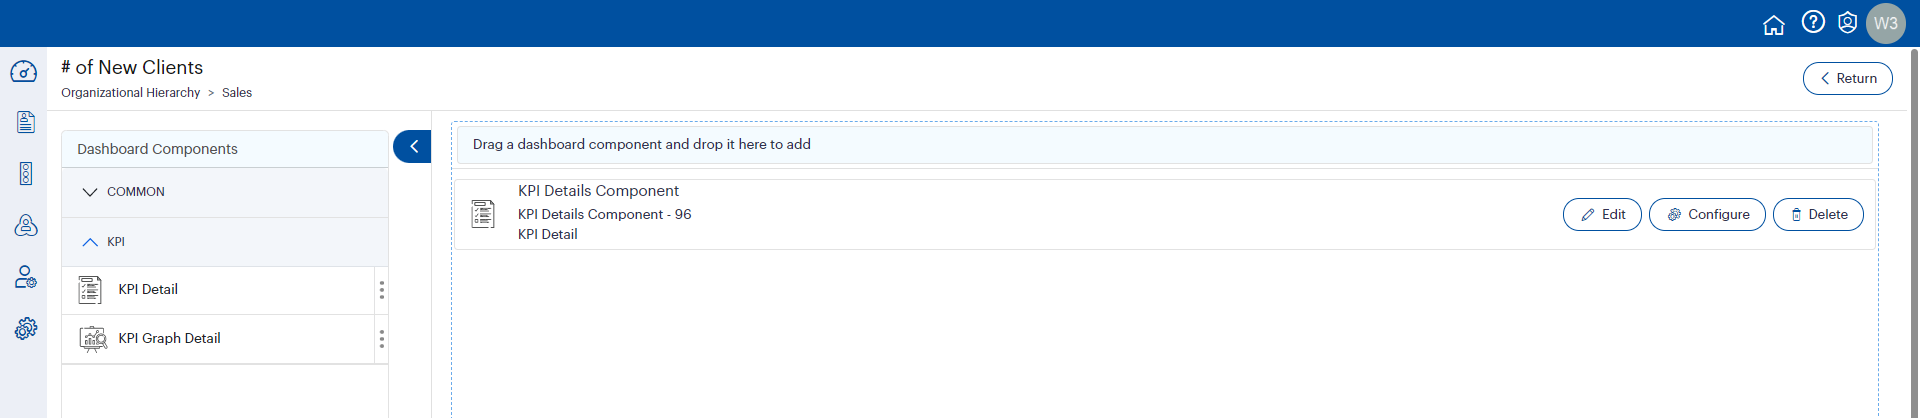
- Only the components KPI detail and KPI Graph Detail will be shown in the Individual KPI configuration. You can drag and drop components to the design area and can configure each KPI.